. 2013 Nov 24:14:826.
doi: 10.1186/1471-2164-14-826.

MMDiff: quantitative testing for shape changes in ChIP-Seq data sets

Affiliations

MMDiff: quantitative testing for shape changes in ChIP-Seq data sets

Gabriele Schweikert et al. BMC Genomics. .

Abstract

Background: Cell-specific gene expression is controlled by epigenetic modifications and transcription factor binding. While genome-wide maps for these protein-DNA interactions have become widely available, quantitative comparison of the resulting ChIP-Seq data sets remains challenging. Current approaches to detect differentially bound or modified regions are mainly borrowed from RNA-Seq data analysis, thus focusing on total counts of fragments mapped to a region, ignoring any information encoded in the shape of the peaks.

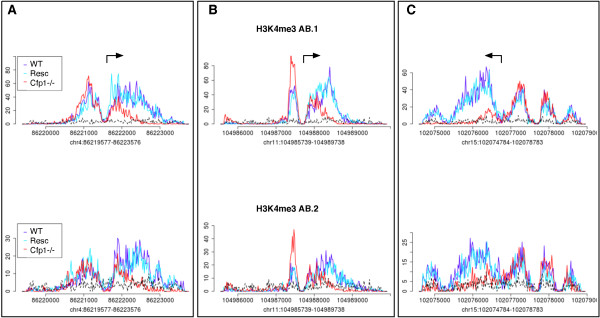
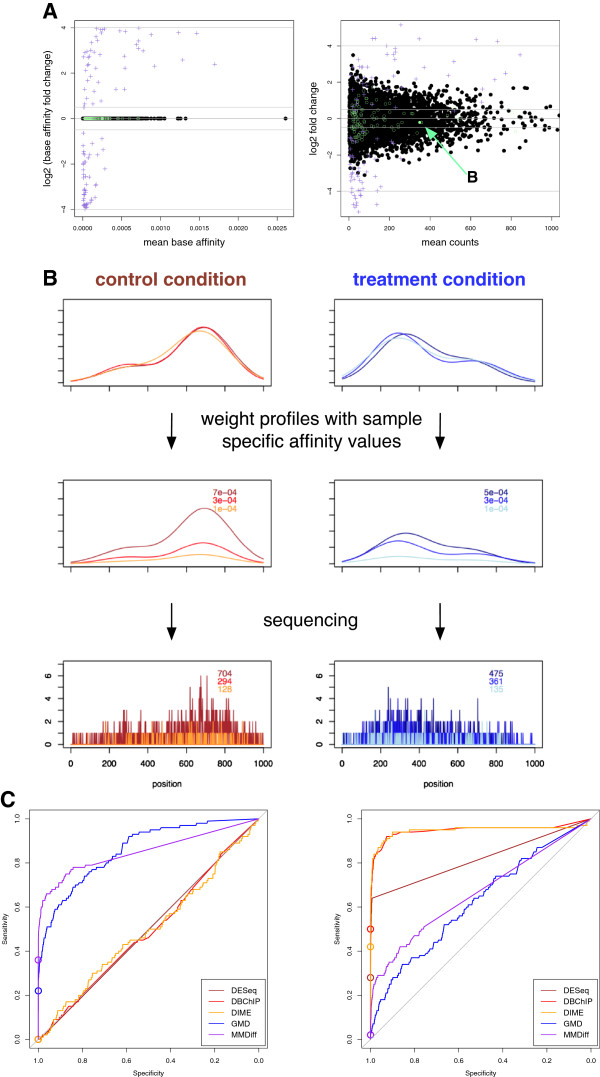
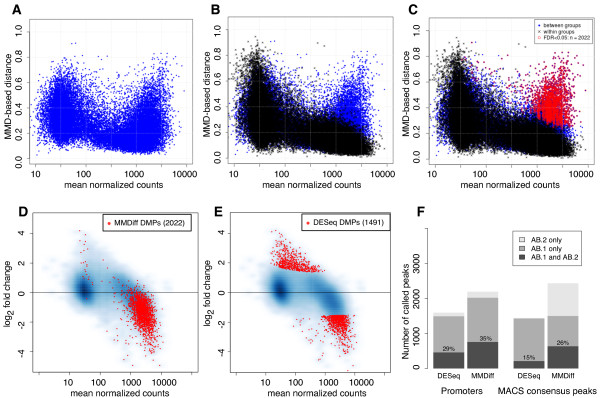
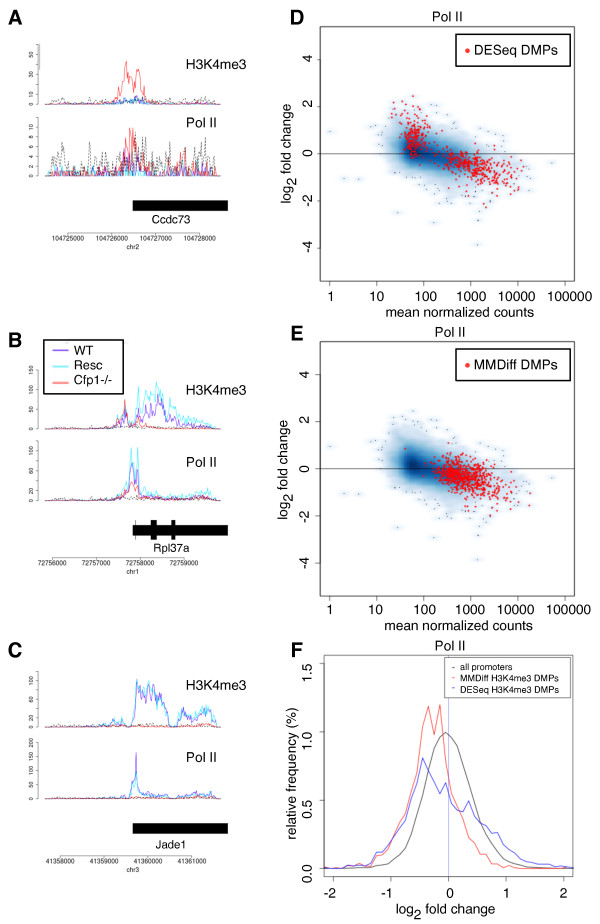
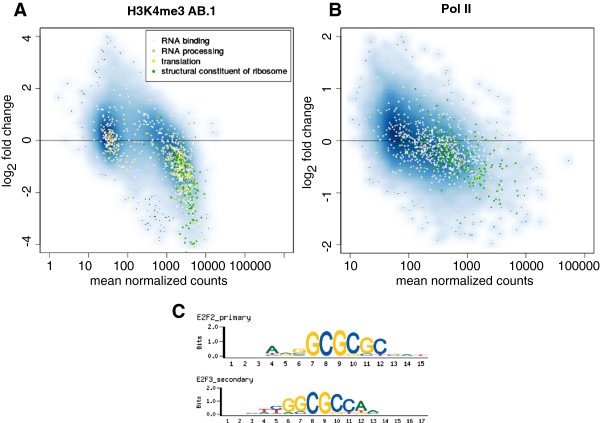
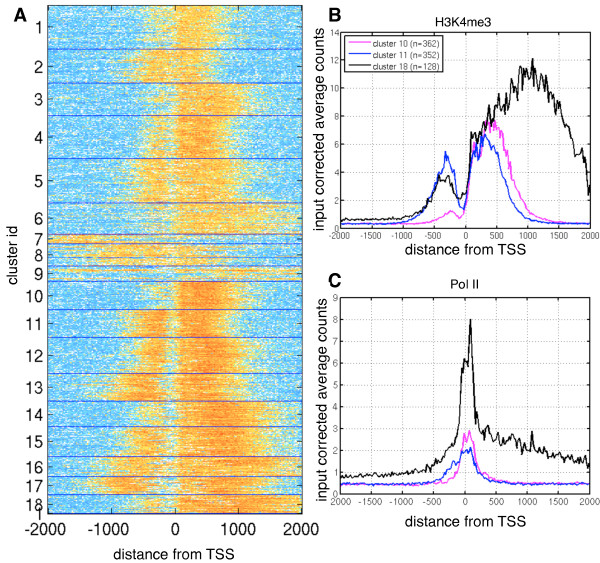
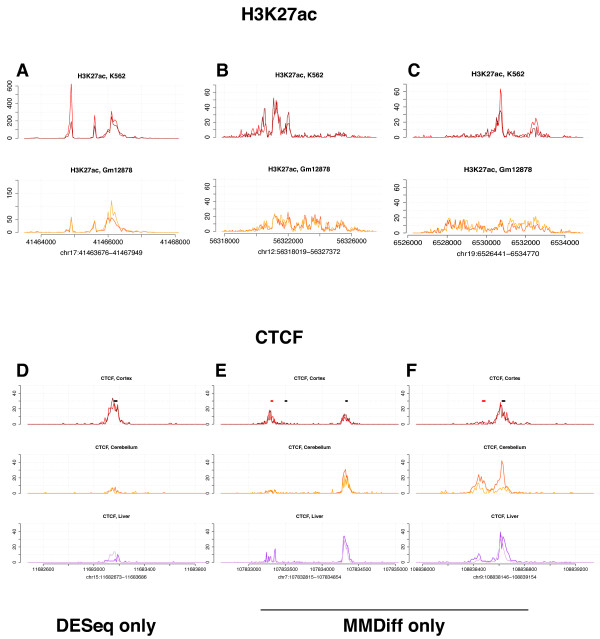
Results: Here, we present MMDiff, a robust, broadly applicable method for detecting differences between sequence count data sets. Based on quantifying shape changes in signal profiles, it overcomes challenges imposed by the highly structured nature of the data and the paucity of replicates.We first use a simulated data set to compare the performance of MMDiff with results obtained by four alternative methods. We demonstrate that MMDiff excels when peak profiles change between samples. We next use MMDiff to re-analyse a recent data set of the histone modification H3K4me3 elucidating the establishment of this prominent epigenomic marker. Our empirical analysis shows that the method yields reproducible results across experiments, and is able to detect functional important changes in histone modifications. To further explore the broader applicability of MMDiff, we apply it to two ENCODE data sets: one investigating the histone modification H3K27ac and one measuring the genome-wide binding of the transcription factor CTCF. In both cases, MMDiff proves to be complementary to count-based methods. In addition, we can show that MMDiff is capable of directly detecting changes of homotypic binding events at neighbouring binding sites. MMDiff is readily available as a Bioconductor package.

Conclusions: Our results demonstrate that higher order features of ChIP-Seq peaks carry relevant and often complementary information to total counts, and hence are important in assessing differential histone modifications and transcription factor binding. We have developed a new computational method, MMDiff, that is capable of exploring these features and therefore closes an existing gap in the analysis of ChIP-Seq data sets.


Figures

Figure 1
Figure 1
H3K4me3 profiles at three different transcription start sites. Profiles in A and B show a typical bimoodal structure, while the peak displayed in C is more complex. Data from three different samples (WT, Resc, Cfp1-/-) and measured in two repeat experiments (AB.1: upper panel and AB.2: lower panel) are shown. Arrows indicate transcription starts sites and direction of transcription. Shown are normalised read counts. Note, that in contrast to coverage plots, reads are here only represented by their estimated mid points. The patterns for WT and Resc strongly resemble each other and while the signal in experiment AB.2 is noisier than in AB.1, the overall shapes are very similar. In the Cfp1-/- sample read coverage appears to be reduced in parts of the regions. However, the second example shows that a decrease in one part of the region can be compensated for by a gain of signal in an upstream region. All three examples were consistently called by MMDiff in both experiments, but not called by any other method.
Figure 2
Figure 2
Simulated ChIP-Seq experiment. A: MA-plots for simulated peaks; Each dot corresponds to a single peak. Black dots, green circles and purple crosses indicate unchanged sites, sites with changed profiles and sites with affinity changes, respectively. The left plot shows changes in base affinity in treatment vs control as a function of mean peak affinity, no biological variability and no sequencing effects are considered. In contrast, the right panel results if biological variance (Gamma distributed) and sampling of reads (Poisson distributed) are simulated. In this case, sites with unchanged base affinity may still show substantial fold changes, which hampers the detection of true differential sites. The filled green circle marked by an arrow corresponds to the profile depicted in detail in B: Simulated example profiles (mixtures of two Gaussian curves) with profile change simulated as a change in the mixing parameter. Left panels correspond to the control condition, right panels to the treatment condition. First row shows three peak profiles for each condition and the area under the curves integrates to 1. Within each condition there is a small degree of variability regarding the position and width of the two sub-peaks and also their relative strength. Between conditions the mixing parameter changes substantially. In the middle row, each of the six profiles is weighted with the sample specific affinity value for the given peak. The areas under the curves now vary between samples. In the bottom row, the sequencing process is simulated with a Poisson distribution resulting in histograms of reads mapping along the extend of the peak. C: Receiver operator characteristic (ROC) curves for various methods. Left: only unchanged sites and sites with profile changes are considered; Right: only unchanged sites and sites with affinity changes are used. Circles indicate the considered operating point (FDR=0.05).
Figure 3
Figure 3
Differential calling and reproducibility in H3K4me3 ChIP-Seq data sets. A-C MMD-based distances as a function of mean total counts in experiment AB.1. Each dot represents one examined promoter. A MMD values computed between Cfp1-/- and WT. B MMD determined between Resc and WT overlayed in black. These provide a measure of the biological and experimental variability. C Plots are overlayed and promoters that are significantly different in Cfp1-/- versus WT/Resc (FDR < 0.05) are shown in red. D-E MA plot representations of the same data showing smooth scatter plots of log2 fold changes versus mean normalised counts. The red dots mark promoters detected as differentially modified (DMPs) at a 5% false discovery rate. D DMPs according to MMDiff and E according to DESeq. F Reproducibility of differential calling across experiments AB.1 and AB.2. DESeq and MMDiff are compared both for differentially called promoters (left) and for MACS consensus peaks.
Figure 4
Figure 4
Changes of H3K4me3 levels are correlated with changes in Pol II binding.A-C Example DMPs at three annotated genes, showing H3K4me3 patterns and Pol II binding profiles. Input is shown as dashed, black lines. A Promoter called by DESeq but not MMDiff showing an increased H3K4me3 peak in the Cfp1-/- sample. B Promoter called by MMDiff but not DESeq with substantial decrease in H3K4me3 and modest change in Pol II binding. C Promoter of Jade-1 showing complete loss of H3K4me3 accompanied with elimination of Pol II binding (called by both). D, E MA-plots of Pol II binding. Promoters with significant differential H3K4me3 patterns are marked with red dots: D DMPs according to DESeq and E DMPs according to MMDiff. F Distribution of observed fold changes in Pol II binding (Cfp1-/- versus WT/Resc). black: all promoters, red: DMPs detected by MMDiff (Wilcoxon rank sum test, p-value < 10-15). blue: DMPs detected by DESeq: p-value < 10-13.
Figure 5
Figure 5
Functional annotation of DMPs. MA-plots for A H3K4me3 modifications and B Pol II binding. All genes annotated with specific GO Terms are marked with the corresponding colour. Ribosomal RNAs and proteins, as well as genes involved in translation and RNA binding and processing seem to be most affected by loss of Cfp1. C enriched sequence motifs found in DMPs, showing the binding motifs of E2F family transcription factors.
Figure 6
Figure 6
H3K4me3 clusters at promoters. A: Heat map representation of H3K4me3 enrichment in WT, each line represents a single promoter. X-axis shows distance from TSS in bp and regions are aligned such that the direction of transcription is from left to right. Promoters are sorted by cluster membership. B Averaged H3K4m3 profiles for cluster 10, 11 and 18. C Averaged Pol II profiles for the same clusters.
Figure 7
Figure 7
Differential peak calling in H3K27ac and CTCF data sets. A-C: Three example H3K27ac peaks called as differential when comparing human K562 and GM12878 cell lines (data from ENCODE consortium). D-F Three example CTCF peaks in samples derived from mouse cortex, cerebellum and liver. Peaks are called differential in the cortex vs cerebellum comparison. Black and red bars demark CTCF motifs on the forward and reverse strand, respectively. Peaks shown in A, D) are called by DESeq only; peaks in B, C, E, F are called by MMDiff only.

References

    1. ENCODE Project Consortium. An integrated encyclopedia of DNA elements in the human genome. Nature. 2012;14(7414):57–74. doi: 10.1038/nature11247. - DOI - PMC - PubMed
    1. Park PJ. ChIP-seq: advantages and challenges of a maturing technology. Nat Rev Genet. 2009;14(10):669–680. doi: 10.1038/nrg2641. - DOI - PMC - PubMed
    1. Wilbanks EG, Facciotti MT. Evaluation of algorithm performance in ChIP-seq peak detection. PLoS One. 2010;14(7):e11471. doi: 10.1371/journal.pone.0011471. - DOI - PMC - PubMed
    1. Schmidt D, Wilson MD, Ballester B, Schwalie PC, Brown GD, Marshall A, Kutter C, Watt S, Martinez-Jimenez CP, Mackay S, Talianidis I, Flicek P, Odom DT. Five-vertebrate ChIP-seq reveals the evolutionary dynamics of transcription factor binding. Science. 2010;14(5981):1036–1040. doi: 10.1126/science.1186176. - DOI - PMC - PubMed
    1. Chikina MD, Troyanskaya OG. An effective statistical evaluation of ChIPseq dataset similarity. Bioinformatics. 2012;14(5):607–613. doi: 10.1093/bioinformatics/bts009. - DOI - PMC - PubMed

Publication types

LinkOut - more resources