

Towards the integration, annotation and association of historical microarray experiments with RNA-seq
- PMID: 24268045
- PMCID: PMC3851429
- DOI: 10.1186/1471-2105-14-S14-S4
Towards the integration, annotation and association of historical microarray experiments with RNA-seq
Abstract
Background: Transcriptome analysis by microarrays has produced important advances in biomedicine. For instance in multiple myeloma (MM), microarray approaches led to the development of an effective disease subtyping via cluster assignment, and a 70 gene risk score. Both enabled an improved molecular understanding of MM, and have provided prognostic information for the purposes of clinical management. Many researchers are now transitioning to Next Generation Sequencing (NGS) approaches and RNA-seq in particular, due to its discovery-based nature, improved sensitivity, and dynamic range. Additionally, RNA-seq allows for the analysis of gene isoforms, splice variants, and novel gene fusions. Given the voluminous amounts of historical microarray data, there is now a need to associate and integrate microarray and RNA-seq data via advanced bioinformatic approaches.
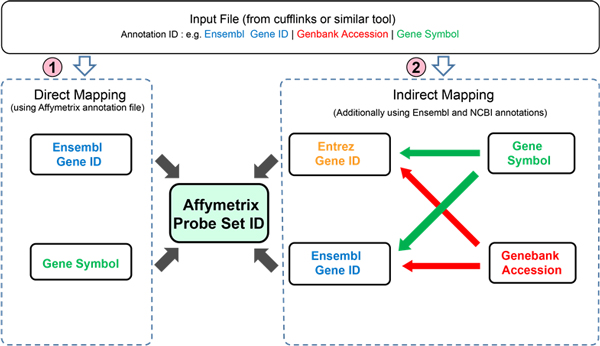
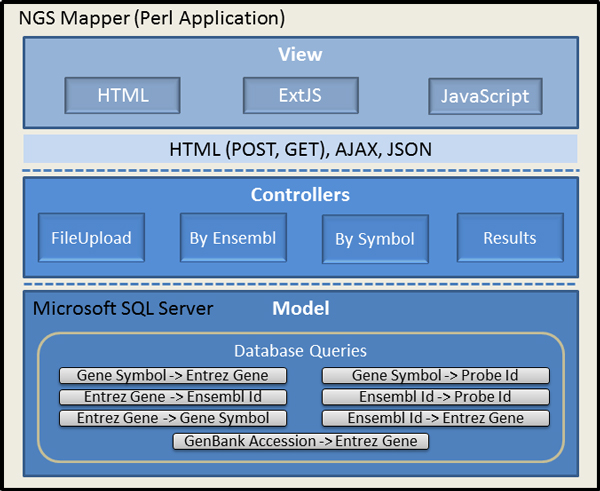
Methods: Custom software was developed following a model-view-controller (MVC) approach to integrate Affymetrix probe set-IDs, and gene annotation information from a variety of sources. The tool/approach employs an assortment of strategies to integrate, cross reference, and associate microarray and RNA-seq datasets.
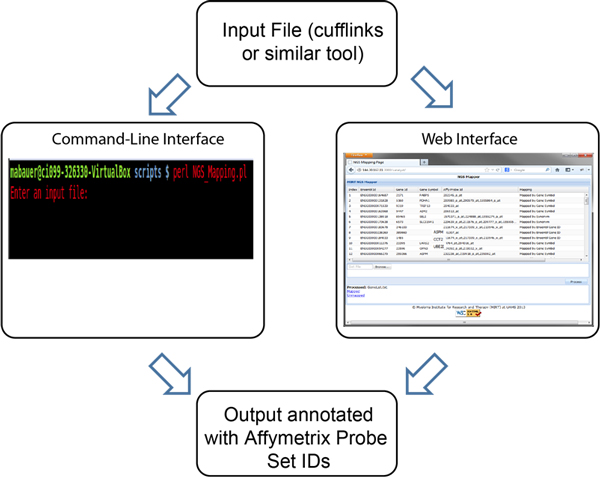
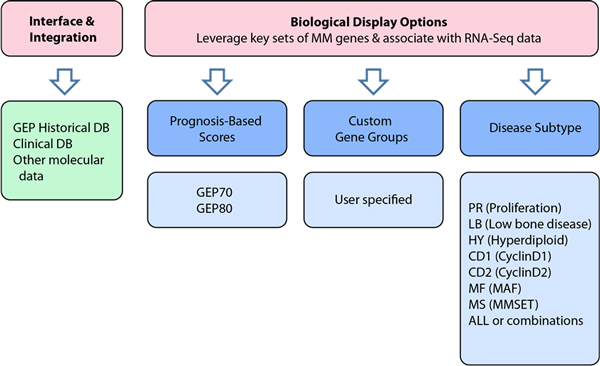
Results: Output from a variety of transcriptome reconstruction and quantitation tools (e.g., Cufflinks) can be directly integrated, and/or associated with Affymetrix probe set data, as well as necessary gene identifiers and/or symbols from a diversity of sources. Strategies are employed to maximize the annotation and cross referencing process. Custom gene sets (e.g., MM 70 risk score (GEP-70)) can be specified, and the tool can be directly assimilated into an RNA-seq pipeline.
Conclusion: A novel bioinformatic approach to aid in the facilitation of both annotation and association of historic microarray data, in conjunction with richer RNA-seq data, is now assisting with the study of MM cancer biology.
Figures
Similar articles
-
Comparison of RNA-Seq and microarray in transcriptome profiling of activated T cells.PLoS One. 2014 Jan 16;9(1):e78644. doi: 10.1371/journal.pone.0078644. eCollection 2014. PLoS One. 2014. PMID: 24454679 Free PMC article.
-
RNA-Seq technology and its application in fish transcriptomics.OMICS. 2014 Feb;18(2):98-110. doi: 10.1089/omi.2013.0110. Epub 2013 Dec 31. OMICS. 2014. PMID: 24380445 Free PMC article. Review.
-
SPARTA: Simple Program for Automated reference-based bacterial RNA-seq Transcriptome Analysis.BMC Bioinformatics. 2016 Feb 4;17:66. doi: 10.1186/s12859-016-0923-y. BMC Bioinformatics. 2016. PMID: 26847232 Free PMC article.
-
Using microarray-based subtyping methods for breast cancer in the era of high-throughput RNA sequencing.Mol Oncol. 2018 Dec;12(12):2136-2146. doi: 10.1002/1878-0261.12389. Epub 2018 Oct 29. Mol Oncol. 2018. PMID: 30289602 Free PMC article.
-
Towards next generation CHO cell biology: Bioinformatics methods for RNA-Seq-based expression profiling.Biotechnol J. 2015 Jul;10(7):950-66. doi: 10.1002/biot.201500107. Epub 2015 Jun 9. Biotechnol J. 2015. PMID: 26058739 Review.
Cited by
-
Leveraging the new with the old: providing a framework for the integration of historic microarray studies with next generation sequencing.BMC Bioinformatics. 2014;15 Suppl 11(Suppl 11):S3. doi: 10.1186/1471-2105-15-S11-S3. Epub 2014 Oct 21. BMC Bioinformatics. 2014. PMID: 25350881 Free PMC article.
-
An omics approach to delineating the molecular mechanisms that underlie the biological effects of physical plasma.Biophys Rev (Melville). 2023 Mar 28;4(1):011312. doi: 10.1063/5.0089831. eCollection 2023 Mar. Biophys Rev (Melville). 2023. PMID: 38510160 Free PMC article. Review.
-
Risk stratification in myelodysplastic syndromes: is there a role for gene expression profiling?Expert Rev Hematol. 2014 Apr;7(2):191-4. doi: 10.1586/17474086.2014.891437. Epub 2014 Feb 24. Expert Rev Hematol. 2014. PMID: 24559255 Free PMC article.
-
Transcriptome analysis of the Capra hircus ovary.PLoS One. 2015 Mar 30;10(3):e0121586. doi: 10.1371/journal.pone.0121586. eCollection 2015. PLoS One. 2015. PMID: 25822507 Free PMC article.
-
Proceedings of the 2013 MidSouth Computational Biology and Bioinformatics Society (MCBIOS) Conference.BMC Bioinformatics. 2013;14 Suppl 14(Suppl 14):S1. doi: 10.1186/1471-2105-14-S14-S1. Epub 2013 Oct 9. BMC Bioinformatics. 2013. PMID: 24267415 Free PMC article.
References
Publication types
MeSH terms
Substances
Grants and funding
LinkOut - more resources
Full Text Sources
Other Literature Sources
