. 2013 Nov 27;5(4):878-85.
doi: 10.1016/j.celrep.2013.10.034. Epub 2013 Nov 21.

Widespread mitochondrial depletion via mitophagy does not compromise necroptosis

Affiliations

Widespread mitochondrial depletion via mitophagy does not compromise necroptosis

Stephen W G Tait et al. Cell Rep. .

Abstract

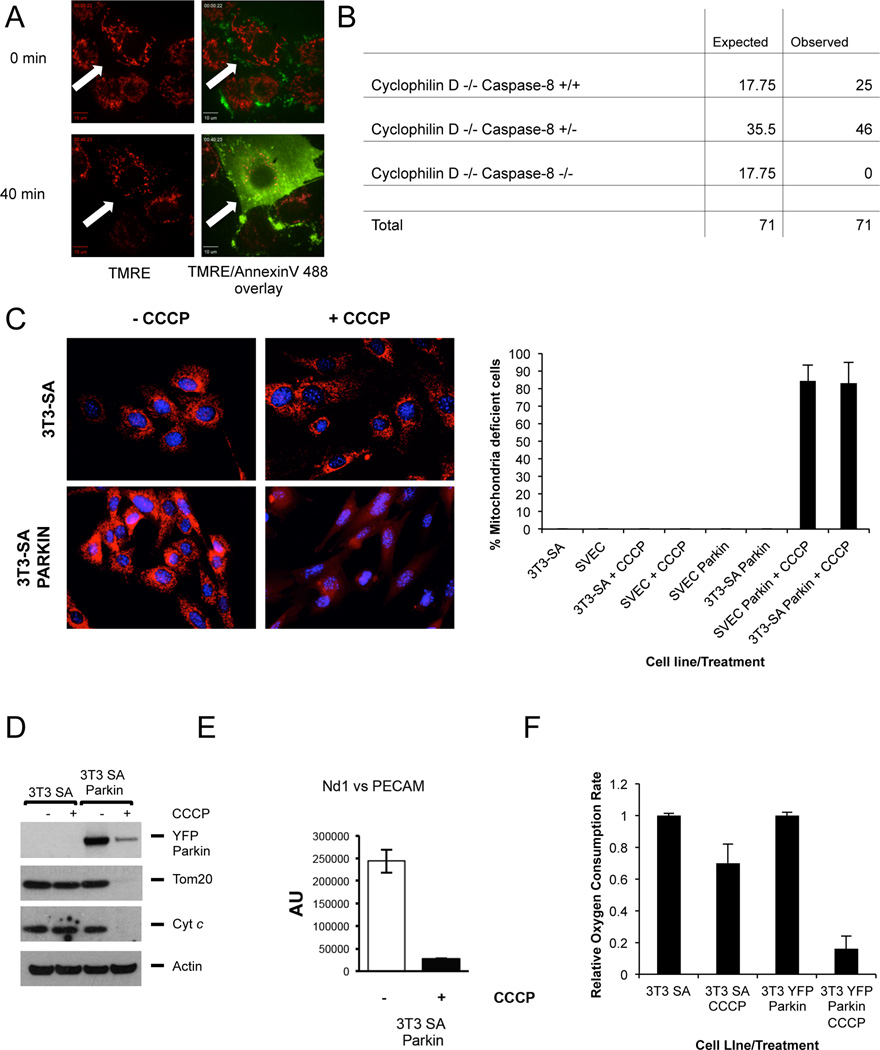
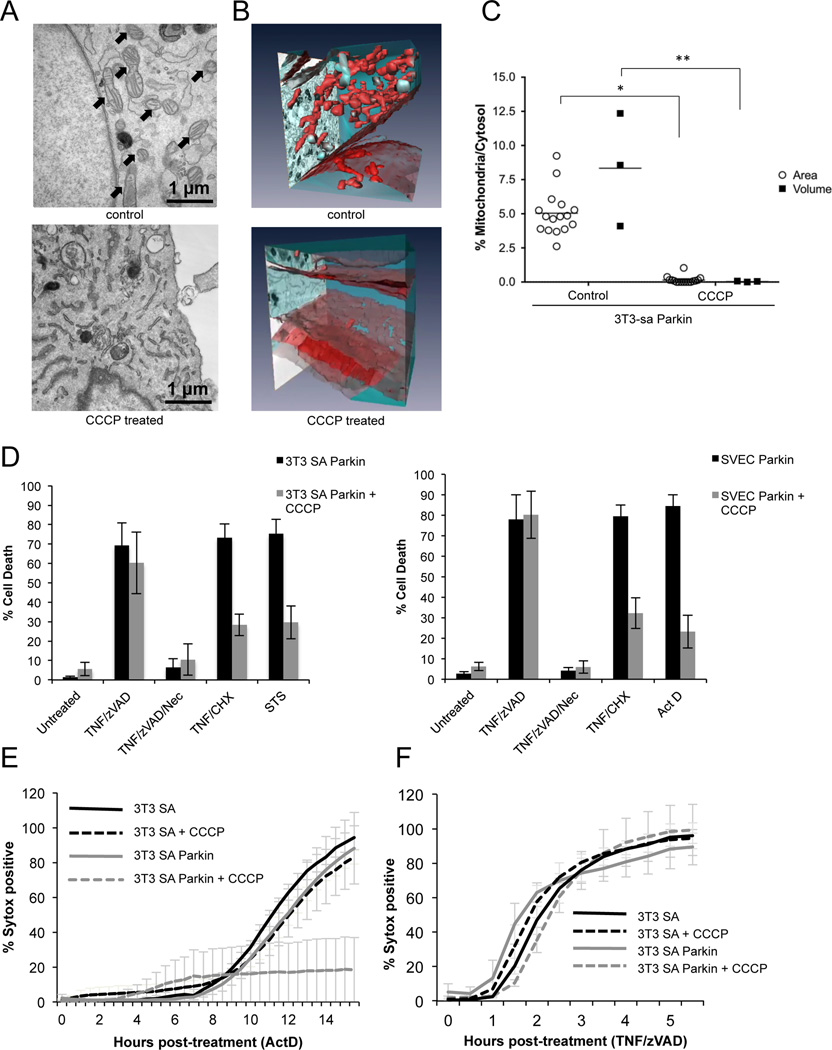
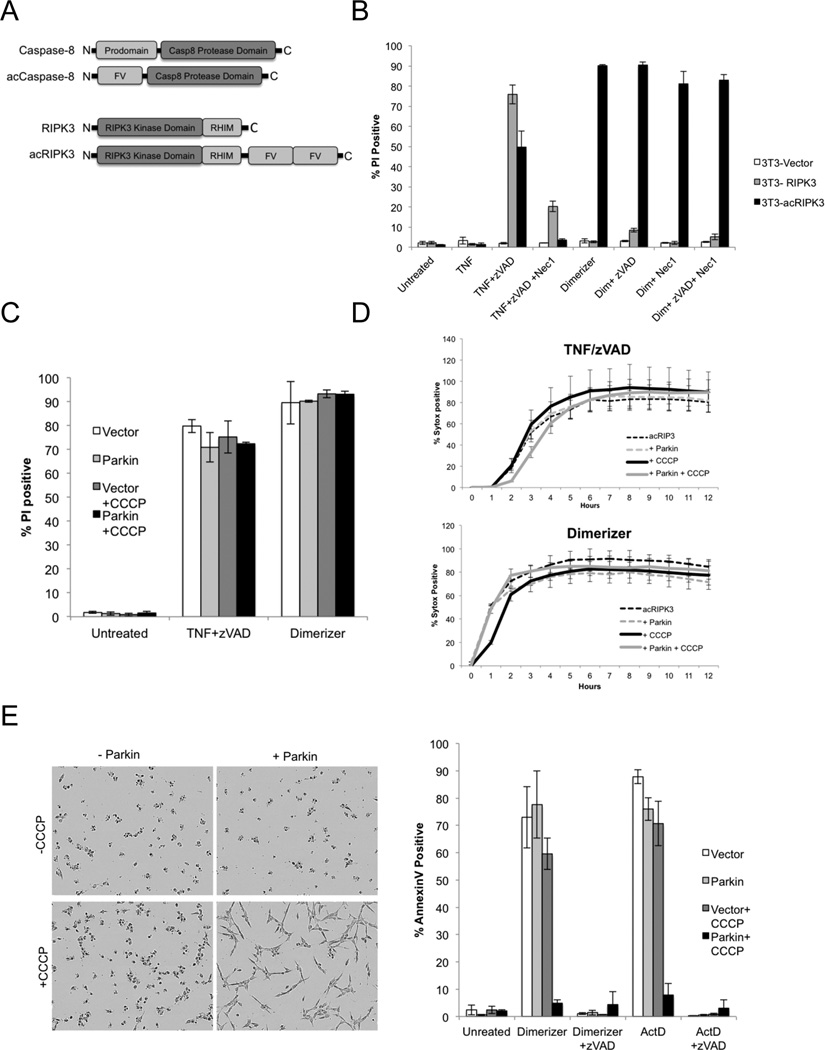
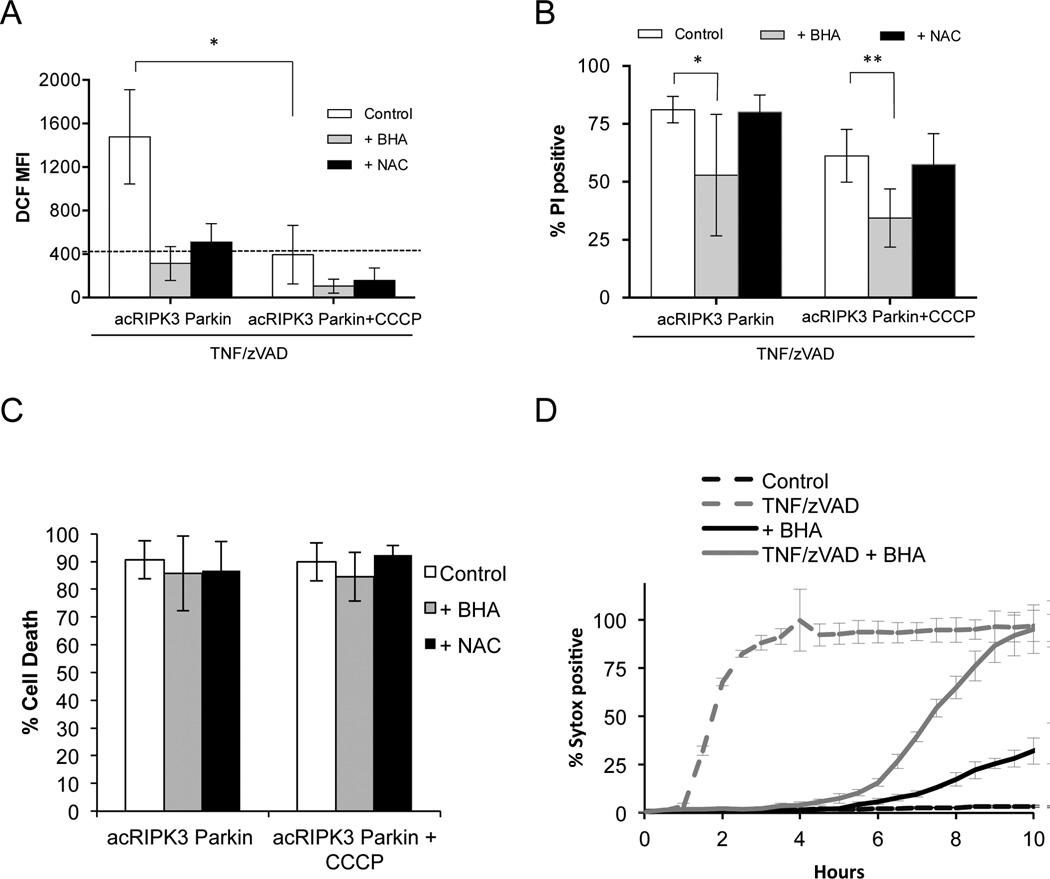
Programmed necrosis (or necroptosis) is a form of cell death triggered by the activation of receptor interacting protein kinase-3 (RIPK3). Several reports have implicated mitochondria and mitochondrial reactive oxygen species (ROS) generation as effectors of RIPK3-dependent cell death. Here, we directly test this idea by employing a method for the specific removal of mitochondria via mitophagy. Mitochondria-deficient cells were resistant to the mitochondrial pathway of apoptosis, but efficiently died via tumor necrosis factor (TNF)-induced, RIPK3-dependent programmed necrosis or as a result of direct oligomerization of RIPK3. Although the ROS scavenger butylated hydroxyanisole (BHA) delayed TNF-induced necroptosis, it had no effect on necroptosis induced by RIPK3 oligomerization. Furthermore, although TNF-induced ROS production was dependent on mitochondria, the inhibition of TNF-induced necroptosis by BHA was observed in mitochondria-depleted cells. Our data indicate that mitochondrial ROS production accompanies, but does not cause, RIPK3-dependent necroptotic cell death.


Figures

Figure 1
Figure 1. Necroptosis executes independently of mitochondrial permeability transition
A. SVEC cells were incubated with TMRE/Annexin V Alexa Fluor 488, treated with TNF+zVAD and imaged by live-cell confocal microscopy. Images following initial treatment and at the point of cell lysis are shown. Arrow denotes the same cell at different time-points B. Expected and observed frequency of caspase-8/cyclophilin D status in offspring from crosses of cyclophilin D −/− caspase 8 +/− mice. C. Left: Representative images of control or Parkin expressing 3T3-SA cells treated +/− CCCP for 48 hours and immunostained with anti-Tom20 antibody. Right: Quantitation of control or Parkin expressing 3T3-SA or SVEC cells treated +/− CCCP for 48 hours that lack mitochondrial Tom20 staining. A minimum of 100 cells were counted per condition per experiment. Error bars represent the standard deviation (S.D.) from the mean of 3 independent experiments. D. Control or Parkin expressing 3T3-SA or cells were treated with CCCP for 48 hours and protein expression was monitored by Western blot. Actin was used as a loading control. E. Parkin expressing 3T3-SA cells were treated with CCCP for 48 hours and assayed for mtDNA copy number per nuclear genome. Error bars represent S.D. from the mean of triplicate samples. Data are representative of 3 independent experiments. The same pool of cells was used for the EM analysis in fig, 2A-B. F. Control or Parkin expressing 3T3-SA cells were treated with CCCP for 48 hours and oxygen consumption was determined and is displayed relative to the untreated control. Error bars represent S.D. from the mean of triplicate samples. Data are representative of 3 independent experiments. See also Figure S1 and Movie S1.
Figure 2
Figure 2. TNF dependent necroptosis does not require mitochondria
A. Representative TEM images of control or CCCP treated 3T3-SA Parkin expressing cells, arrows denote mitochondria. B Representative 3D-EM images of control or CCCP treated 3T3-SA Parkin expressing cells. Mitochondria are colored red and cytosol is colored blue. B. 3D-EM quantification of mitochondrial mass of Parkin expressing 3T3-SA treated with CCCP for 48 hours. Black squares represent the ratio of “Area Mitochondria/Area Cytosol” and expressed as percentages (%Area Mitochondria/Area Cytosol); white circles represent the percentage of the ratio “Volume Mitochondria/Volume Cytosol”. For further information see Materials and Methods. *, P<0.0001, **, P<0.05. C. Control or Parkin expressing 3T3-SA or SVEC cells were treated with CCCP for 48 hours then treated with the indicated stimuli for 8 hours (TNF/zVAD, TNF/CHX) or overnight with staurosporine (STS) or actinomycin D (ActD). Cell death was determined by propidium iodide (PI) positivity and flow cytometry. D. Mitochondria depletion was triggered in 3T3-SA cells by CCCP treatment for 48 hours, and cells were treated with ActD as indicated. Cell death was assayed using Sytox Green uptake over time in an IncuCyte imager. E. Mitochondria depletion was triggered in 3T3-SA cells by CCCP treatment for 48 hours, and cells were treated with TNF/zVAD as indicated. Cell death was assayed using Sytox Green uptake over time in an IncuCyte imager. Sytox positive cell counts were normalized to total cell numbers using the cell-permeable dye Syto24. Error bars represent the S.D. from the mean of 3 independent experiments. See also Movies S2 and S3.
Figure 3
Figure 3. Direct induction of programmed cell death demonstrates a role for mitochondria in apoptosis, but not in programmed necrosis
A. Schematic representation of fusion proteins used to directly induce apoptosis (acCaspase-8) or programmed necrosis (acRIPK3) B. NIH-3T3 cells stably transduced with RIPK3 or acRIPK3 were treated as indicated, and cell death was determined by PI positivity and flow cytometry 4 hours later. C. NIH-3T3 cells expressing acRIPK3 as well as either LZRS vector or Parkin-LZRS were treated with CCCP as indicated to induce elimination of mitochondria. 48 hours later, cell death was induced using the treatments indicated. D. NIH-3T3 cells expressing acRIPK3 were treated to deplete mitochondria and cell death was quantified using an IncuCyte imager. Sytox positive cell counts were normalized to total cell numbers using the cell-permeable dye Syto24. E. NIH-3T3 cells expressing acCaspase-8 as well as either LZRS vector or Parkin-LZRS were treated with CCCP as indicated to induce elimination of mitochondria as described in Figure 1. 48 hours later, cell death was induced using the treatments indicated, representative images (left) and percentage of cells displaying Annexin V positivity (right) was analyzed 8 hours after treatment by flow-cytometry. Error bars represent the S.D. from 3 replicate experiments. See also Figure S2.
Figure 4
Figure 4. Elimination of mitochondria prevents necroptosis-associated ROS production, but does not alter RIPK3-dependent cell death
A. NIH-3T3 cells expressing acRIPK3 and Parkin were treated with CCCP to induce mitochondrial elimination, then treated with TNF+zVAD for 2 hours in the presence of the ROS scavangers butyrated hydroxyanisole (BHA) or N-acetylcysteine (NAC). ROS production was measured using the dye DCF. MFI=Mean Fluorescent Intensity. Results shown are the mean ± S.D. of n≥3 independent experiments. *, P<0.001. Black dotted line corresponds to the basal level of ROS in the Control at t=0. B. NIH-3T3 cells treated like in A for 4 hours, were stained with PI and cell death was determined by flow cytometry (mean ± S.D. of n≥3 independent experiments). *, P<0.05, **, P=0.0518 (t test). C. Mitochondria were depleted as in A, and RIPK3 dimerization was triggered in the presence of BHA or NAC. 2 hours later cell death was quantified as in B. (mean ± S.D. of n≥3 independent experiments) D. Mitochondria depletion was triggered in NIH-3T3 cells as in A, and cells were then treated with TNF+zVAD and BHA as indicated. Cell death was measured by Sytox Green uptake over time in an IncuCyte imager. Data show one representative experiment of three independent experiments. See also Figure S3.

References

    1. Baines CP, Kaiser RA, Purcell NH, Blair NS, Osinska H, Hambleton MA, Brunskill EW, Sayen MR, Gottlieb RA, Dorn GW, et al. Loss of cyclophilin D reveals a critical role for mitochondrial permeability transition in cell death. Nature. 2005;434:658–662. - PubMed
    1. Cauwels A, Janssen B, Waeytens A, Cuvelier C, Brouckaert P. Caspase inhibition causes hyperacute tumor necrosis factor-induced shock via oxidative stress and phospholipase A2. Nat Immunol. 2003;4:387–393. - PubMed
    1. Ch'en IL, Tsau JS, Molkentin JD, Komatsu M, Hedrick SM. Mechanisms of necroptosis in T cells. The Journal of experimental medicine. 2011;208:633–641. - PMC - PubMed
    1. Cho YS, Challa S, Moquin D, Genga R, Ray TD, Guildford M, Chan FK. Phosphorylation-driven assembly of the RIP1-RIP3 complex regulates programmed necrosis and virus-induced inflammation. Cell. 2009;137:1112–1123. - PMC - PubMed
    1. Dillon CP, Oberst A, Weinlich R, Janke LJ, Kang TB, Ben-Moshe T, Mak TW, Wallach D, Green DR. Survival function of the FADD-CASPASE-8-cFLIP(L) complex. Cell reports. 2012;1:401–407. - PMC - PubMed

Publication types

Substances