. 2013 Dec 5;155(6):1409-21.
doi: 10.1016/j.cell.2013.10.047. Epub 2013 Nov 21.

High-resolution mapping reveals a conserved, widespread, dynamic mRNA methylation program in yeast meiosis

Affiliations

High-resolution mapping reveals a conserved, widespread, dynamic mRNA methylation program in yeast meiosis

Schraga Schwartz et al. Cell. .

Abstract

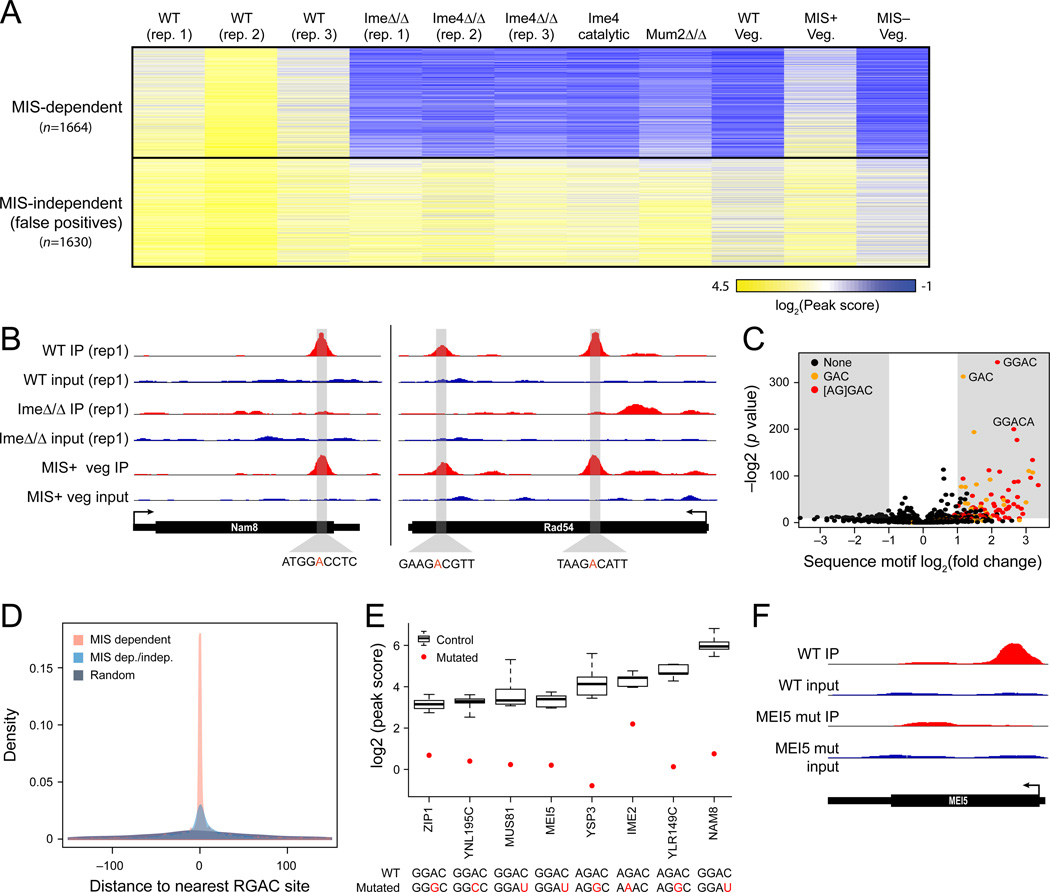
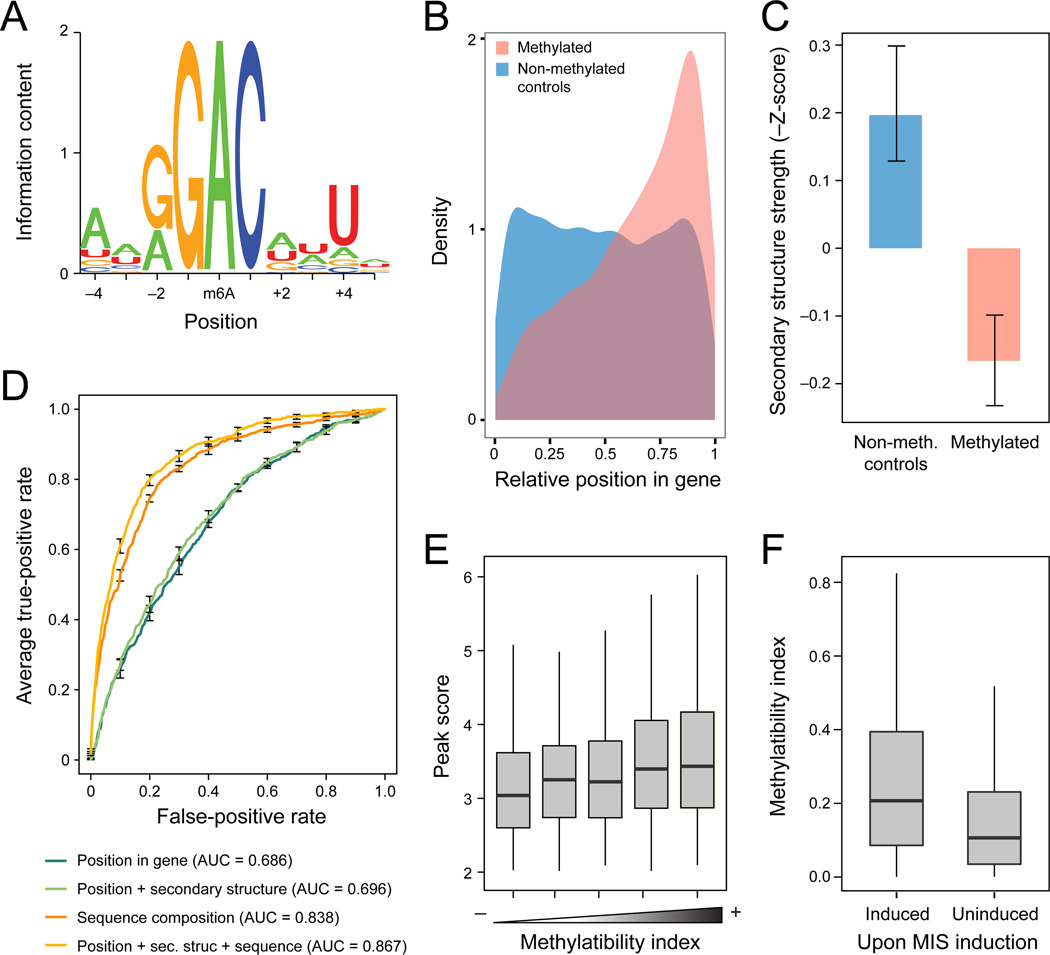
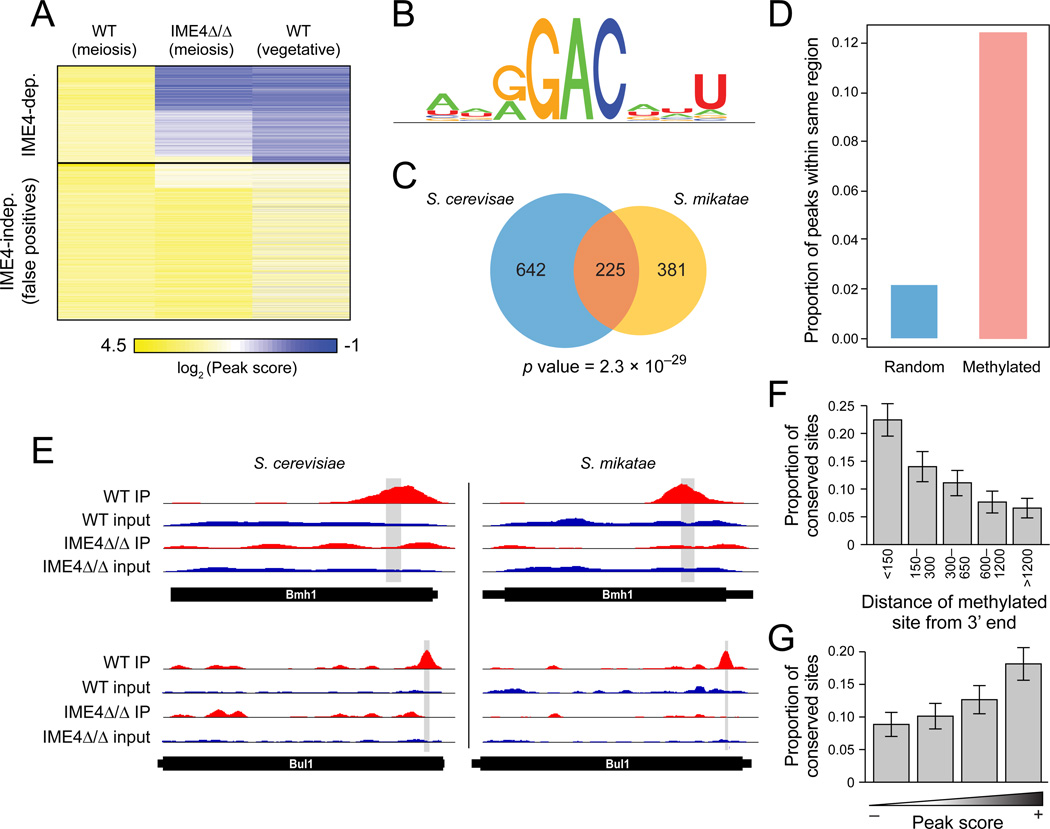
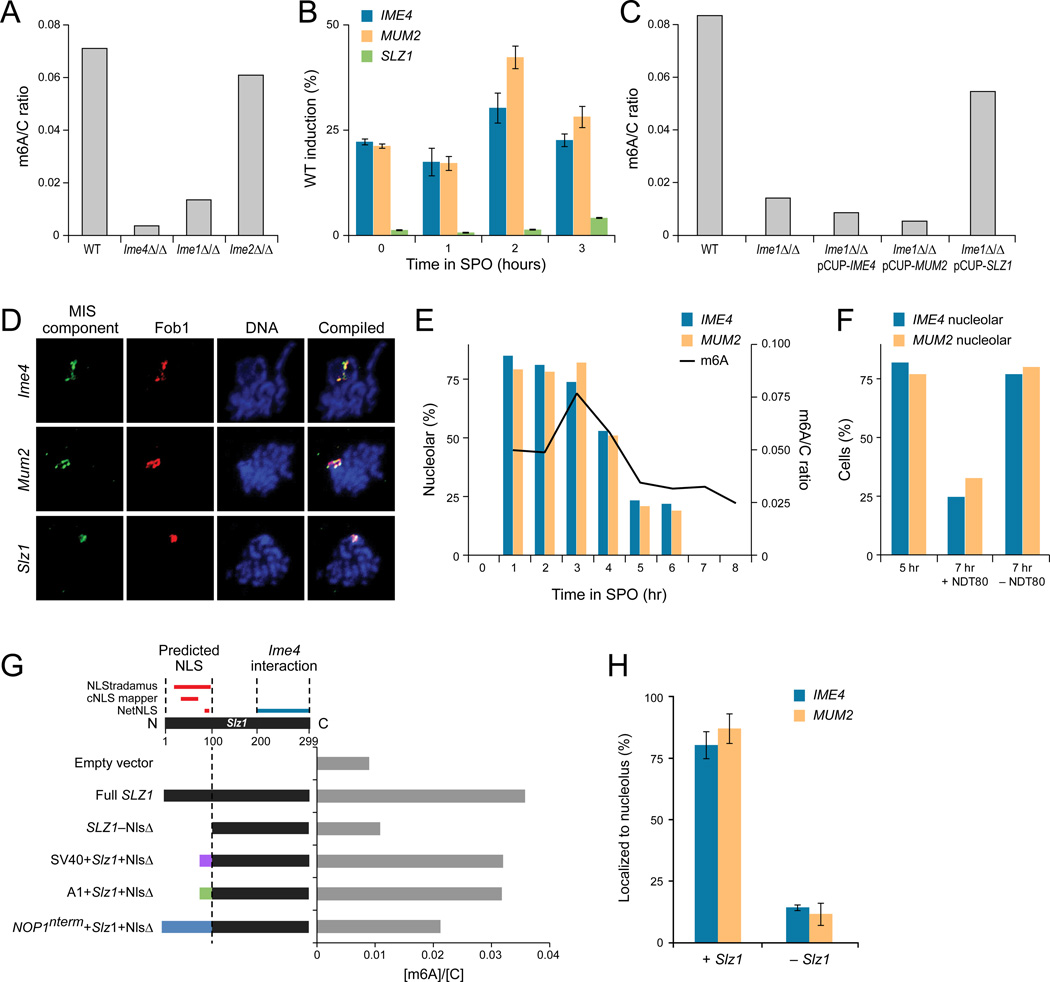
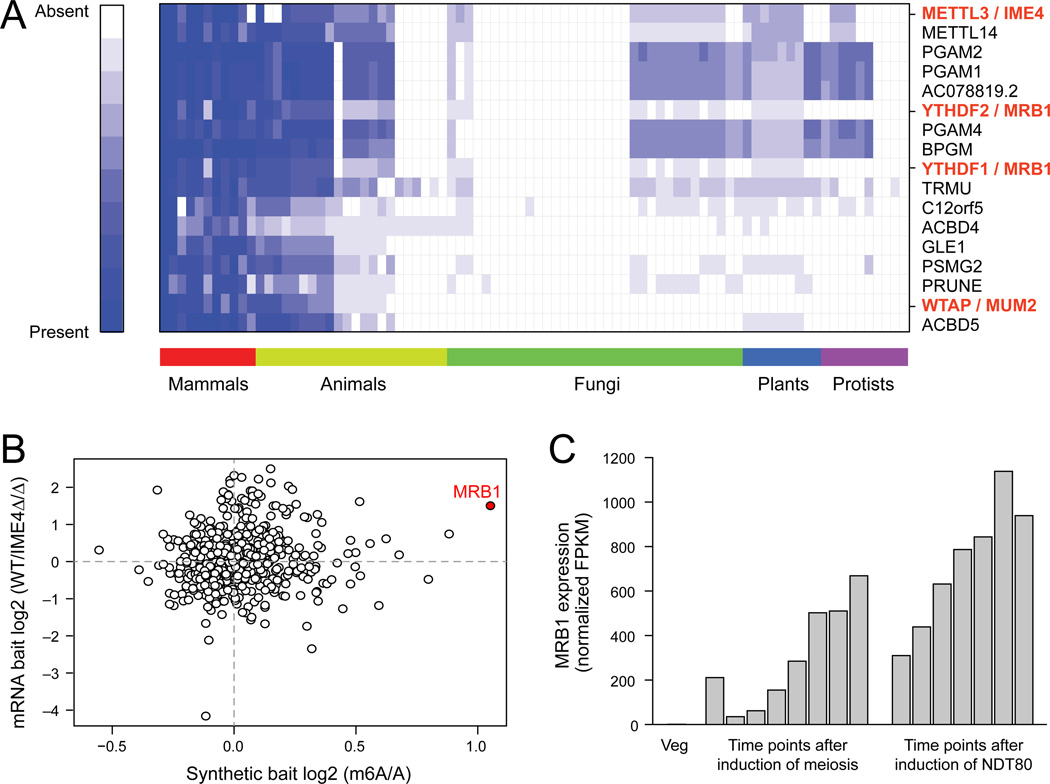
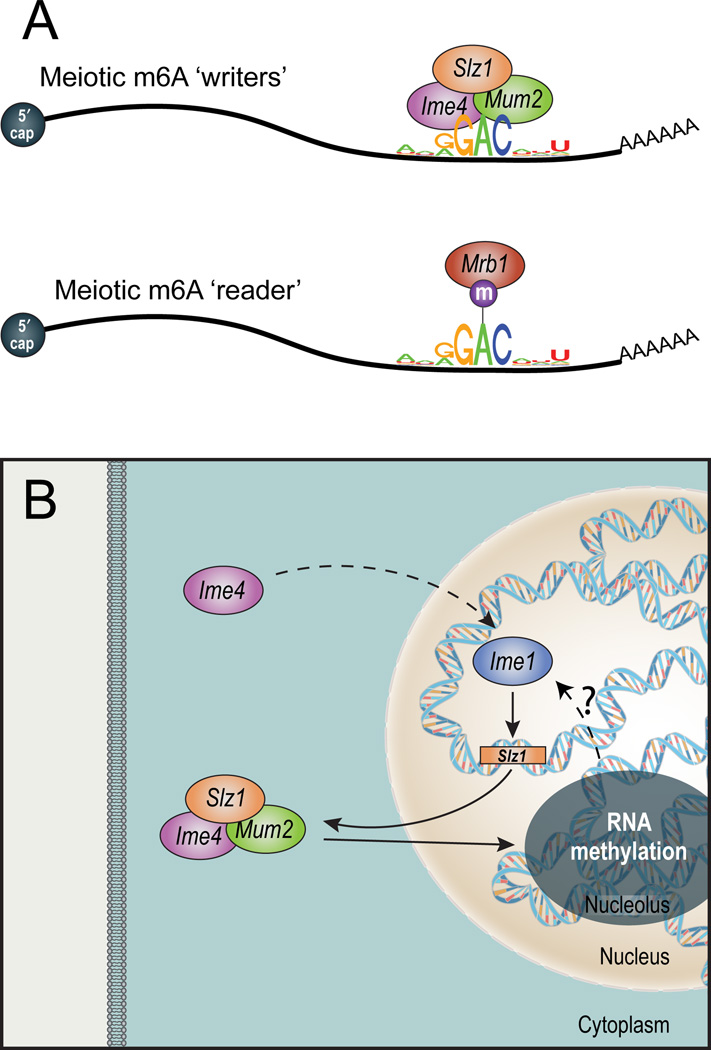
N(6)-methyladenosine (m(6)A) is the most ubiquitous mRNA base modification, but little is known about its precise location, temporal dynamics, and regulation. Here, we generated genomic maps of m(6)A sites in meiotic yeast transcripts at nearly single-nucleotide resolution, identifying 1,308 putatively methylated sites within 1,183 transcripts. We validated eight out of eight methylation sites in different genes with direct genetic analysis, demonstrated that methylated sites are significantly conserved in a related species, and built a model that predicts methylated sites directly from sequence. Sites vary in their methylation profiles along a dense meiotic time course and are regulated both locally, via predictable methylatability of each site, and globally, through the core meiotic circuitry. The methyltransferase complex components localize to the yeast nucleolus, and this localization is essential for mRNA methylation. Our data illuminate a conserved, dynamically regulated methylation program in yeast meiosis and provide an important resource for studying the function of this epitranscriptomic modification.


Figures

Figure 1
Figure 1. Genome-wide identification of MIS-dependent m6A sites with m6A-Seq
(A) Methylation profiles. Heatmap shows the log2 transformed peak scores (fold-change of enrichment of a site over the median level of the gene; yellow: high; blue: low) for 3,294 peaks (rows) that were enriched in at least two of the three WT (ndt80Δ/Δ, SAy841) replicates across different conditions and perturbations (columns; ime4Δ/Δ ndt80Δ/Δ—SAy996, ime4-cat ndt80Δ/Δ—SAy1280, mum2Δ/Δ—SAy1310, wild-type—SAy821, MIS Induction—SAy1248). Sites are clustered using k-means clustering. MIS-dependent and -independent sites are marked on top and bottom, respectively. (B) Example methylated loci. Sequence coverage from m6A-Seq (IP) and control (input) experiments in different strains (tracks) for NAM8 (left) and RAD54 (right). Grey highlight: a 50-nt region surrounding the called peak position, with putative methylation consensus sequence (bottom). (C) Volcano plot of the enrichment (Y axis) and fold change (X axis) of all 3–6nt k-mers in a 50-nt window surrounding identified methylation sites, compared to randomly selected regions from the same genes. Shaded regions: statistically depleted (left) or enriched (right) regions (fold change >2; Bonferroni-corrected P values < 0.05). Orange: sites comprising the GAC core motif; red: sites comprising a full RGAC motif. (D) Methylated sites at near single nucleotide resolution. Density plots of the distribution of the distance between the identified peak and the most adjacent RGAC motif (X axis), for the 1,308 MIS-dependent peaks (red), all MIS-dependent and independent sites (blue), and randomly selected sites within the same genes as the MIS dependent peaks (grey). (E,F) Sequence motif is essential for methylation. (E) m6A-seq peak scores (Y axis) for 8 genes measured in strains where the methylated sequence motif was either WT (top sequence) or mutated (bottom sequence, mutation in red). The distribution of peak scores along WT strains (n=9) is indicated with boxplots (error bars: min and max); red dot: mutant peak score. (F) m6A-Seq (IP) and control (input) for the WT (two top tracks) and mutant (two bottom tracks) alleles of MEI5.
Figure 2
Figure 2. A methylatability model accurately predicts methylated sites solely from sequence, structure and relative position
(A) Methylation motif. Sequence logo of the methylation consensus sequence, based on 711 conservative sites where the peak was within 5 nt of an RGAC site. (B) 3’ end bias of methylated. Distributions of the relative position within the transcript (X axis, 0: 5’ end; 1: 3’ end) for methylated sites (pink) and for sites randomly selected within the same genes (blue). (C) Methylated sites are less structured. Z scores for stability of local secondary structure (Y axis) in a 50 nt window surrounding the methylated position (pink, right) and in random controls (blue, left). Z scores calculated as the minimal free energy by RNAfold, normalized against randomly shuffled sequences of the same length and nucleotide composition. Error bars: SEM. (D) Methylatability model. Receiver-operator curves (ROC) depicting the performance of different logistic regression classifiers in predicting a site’s methylation state based on different sets of features. A model using position, secondary structure and sequence motif information (orange) performs best, with the sequence motif contributing the most (red). (E) Methylatability Index. Boxplots (boxes: lower quartile, median, and upper quartile; whiskers extend to most extreme point no more than 1.5 fold interquartile range) depicting the distributions of the experimentally measured peak score (y-axis) as a function of the computationally assigned Methylatability Index (x-axis). (F) Sites methylated upon MIS activation have higher Methylatability Indexes. Boxplots depicting the distributions of the experimentally measured peak score (y-axis) across sites that underwent methylations upon MIS induction (SAy1248, Induced), or failed to become methylated under these conditions (Uninduced).
Figure 3
Figure 3. Evolutionary conservation of methylation between S. cerevisiae and S. mikatae
(A) m6A-Seq of S. mikatae. Heatmap shows the peak scores (as in Figure 1) for 3,345 peaks (rows) that were enriched (peak score>2) in S. mikatae WT strain under prophase arrest conditions (columns; wild-type meiosis, ndt80Δ/Δ—SAy1428, ime4Δ/Δ ndt80Δ/Δ—SAy1429, wild-type vegetative—SAy1426). Sites are clustered using k-means clustering. MIS-dependent (top) and independent (bottom) sites are denoted. (B) S. mikatate methylation consensus motif. (C) Significant conservation of methylated genes. Venn-diagram depicting the overlap between genes methylated in S. cerevisiae (blue), S. mikatae (orange) and both (pink), and the associated hypergeometric P value. (D) Significant conservation of methylated sites. The proportion of sites detected in S. cerevisiae that are also detected within the orthologous 100-nt region in S. mikatae (pink bar). Blue bar: proportions for a random set of controls. (E) m6A-seq profiles for two example meiosis genes with orthologous methylated positions. (F,G) Stronger and more 3’ sites are more conserved. Proportion of conserved sites (Y axis), as a function of distance from the 3’ end of the transcript (F), or of peak score in S. cerevisiae (G). Error bars: SEM.
Figure 4
Figure 4. Dynamic changes in methylation across meiosis reflect inherent methylatability
(A) Sustained, intermediate and peaked methylation profiles across a meiosis time course. Peak scores (as in Figure 1) for 1,308 peaks (rows) at 6 time points up to prophase arrest, and five time points following NDT80 induction and release from arrest (SAy995) (columns). Sites clustered using k-means. (B) m6A-seq at the ‘sustained’ PAH1 transcript. (C) The temporal window of methylation is consistent with the peak score. Density plots of the distributions of peak-score at prophase arrest (Figure 1A) in the sustained (green), intermediate (orange) and peaked (purple) clusters. (D,E) The temporal window of methylation is longer for genes with higher methylatability index. (D) Mean methylatability index (Y axis; error bars: SEM) for transcripts in the sustained (green), intermediate (orange) and peaked (purple) clusters. (E) Barplots of the average span of methylations (number of timepoints throughout methylation in which peak scores were greater than 2) at 10 quantiles of methylatability index (X axis). Error bars: SEM. (F) Sustained and intermediate methylated sites are more likely to be conserved. Proportion of conserved sites between S. cerevisiae and S. mikatae (Y axis) in each of the three temporal clusters (X axis). (G) IME4 expression correlates with average methylation. Box plots of the distributions (interquartile range and medians) of peak scores across the timecourse, and IME4 expression levels by RNA-Seq across the time points.
Figure 5
Figure 5. IME1 regulates MIS complex induction and nucleolar localization
(A) Ime1 and Ime4 are essential for m6A methylation in meiosis. TLC-based quantification of mRNA m6A relative to cytosine 3 hours after meiotic starvation, when m6A accumulation is maximal in WT cells (SAy821). m6A levels are reduced in mutants in early meiosis genes ime1Δ/Δ (SAy834) and ime4Δ/Δ (SAy1196) but not ime2Δ/Δ (SAy771). (B) Ime1 regulates MIS complex gene expression. Induction of IME4 (blue), MUM2 (red), and SLZ1 (green) transcripts in ime1Δ/Δ background relative to wild-type (by qPCR). Error bars: standard deviation of four replicates. (C) SLZ1 – but not IME4 or MUM2 – overexpression rescues the ime1Δ/Δ methylation defect. Quantification of mRNA m6A relative to cytosine 3 hours after meiotic starvation. Wild-type (SAy821) levels are reduced in ime1Δ/Δ (SAy834) background. Conditional expression of IME4 or MUM2 from the CUP1 promoter in ime1Δ/Δ (SAy1383, SAy1384, respectively) does not overcome this defect, whereas expression of SLZ1 does (SAy1385). (D) The MIS complex localizes to the nucleolus during meiosis. Representative images of immunofluorescence of spread meiotic nuclei, showing colocalization of epitope-tagged Ime4 (SAy914), Mum2 (SAy1235) or Slz1 (SAy1254) (first column) with the nucleolar marker Fob1 (second column). Blue: DNA (DAPI—third column). Compilation (fourth) column: DNA: blue, MIS component: green, Fob1: red. (E) Nucleolar entry and exit of the MIS complex correspond to onset and offset of m6A methylation during meiosis. Quantification of the percentage of cells (Y axis) that show nucleolar co-localization of either Ime4 (blue bars) or Mum2 (red bars) upon induction into sporulation medium. Nucleolar co-localization was determined by immuno-fluorescence of nuclear spreads (n=100 Fob1 foci/time point); percent co-localization at 7 and 8 hours was not quantified as the majority of cells were spores at this time-point. Black curve: m6A abundance relative to cytosine throughout meiosis (right axis). All data were collected from a single meiosis in strain SAy1232. (F) Nucleolar exit dependent on NDT80. % cells showing nucleolar co-localization of Ime4 (blue bars) and Mum2 (orange bars) after treatment with 1µM estradiol (+NDT80) or with solvent (−NDT80) (strain SAy1469). Cells were treated at 5 hours and assayed for nucleolar co-localization after two hours of development in the respective medium. Nucleolar co-localization was determined by immunofluorescence of nuclear spreads (n=100 Fob1 foci/time point). (G, top) Schematic of domains of Slz1, showing predicted nucleolar localization sequence. (G, bottom) Levels of m6A normalized by cytosine (X axis, blue bars) in IME1 deletion strains with either an empty expression vector (empty plasmid--SAy1432), or various alleles of SLZ1 (SAy1422, 1434, 1438, 1441 and 1439, respectively). Samples were taken three hours after strains were induced into meiosis. (H) Quantification of nucleolar colocalization events of either epitope-tagged Mum2 (orange) or Ime4 (blue) with Fob1 in an ime1Δ/Δ PCUP1-SLZ1 strain (SAy1385) with either induction (+SLZ1, left) or no induction (−SLZ1, right). Error bars: standard deviation of three time-points during meiotic prophase, n=100 cells per time-point.
Figure 6
Figure 6. Co-evolution of m6A ‘writers’ and ‘readers’ across eukaryotes
(A) Co-evolution of m6A readers and writers. Phylogenetic profiles for the top 20 proteins co-evolving with human METTL3 across 85 other eukaryotic genomes. For each query protein, the normalized ratio of the BLAST score for the top-scoring protein sequence similarity is indicated in the cell corresponding to each genome. White: 0, no similarity; Blue: 1, 100% similarity. (B) MRB1 binds methylated RNA. Mass-spectrometry based quantification of the levels of proteins pulled down using methylated and non-methylated RNA baits (X axis – in-vitro transcribed, Y axis – poly(A) selected RNA from WT or IME4Δ/Δ strains). Red: MRB1. (C) MRB1 expression is induced during meiosis. RNA-seq derived expression levels (TMM-normalized FPKM values) of MRB1 across a meiotic time course.
Figure 7
Figure 7. Key elements in the yeast meiotic methylation program
(A) The core methylation machinery. The MIS complex (top), active during meiotic prophase, methylates within a sequence motif that is typically 3’ biased and unstructured. The ‘reader’ MRB1 (bottom) binds the methylated motif. (B) Meiotic regulation of mRNA methylation. IME4 induction leads to IME1 accumulation, which induces SLZ1 expression. SLZ1 forms the MIS complex with MUM2 and IME4, and shuttles them into the nucleolus, where mRNA methylation occurs. mRNA methylation may be required for IME1 activation (dashed arrow, ?), thereby possibly closing a positive feedback loop.

References

    1. Agarwala S, Blitzblau H, Hochwagen A, Fink G. RNA methylation by the MIS complex regulates a cell fate decision in yeast. PLoS genetics. 2012;8 - PMC - PubMed
    1. Bodi Z, Button J, Grierson D, Fray R. Yeast targets for mRNA methylation. Nucleic acids research. 2010;38:5327–5335. - PMC - PubMed
    1. Boisvert FM, van Koningsbruggen S, Navascues J, Lamond AI. The multifunctional nucleolus. Nature reviews Molecular cell biology. 2007;8:574–585. - PubMed
    1. Bokar JA. Grosjean Henri., editor. The biosynthesis and functional roles of methylated nucleosides in eukaryotic mRNA. Fine-Tuning of RNA Functions by Modification and Editing. 2005;12:141–177.
    1. Bokar JA, Shambaugh ME, Polayes D, Matera AG, Rottman FM. Purification and cDNA cloning of the AdoMet-binding subunit of the human mRNA (N6-adenosine)-methyltransferase. RNA (New York, NY. 1997;3:1233–1247. - PMC - PubMed

Publication types

MeSH terms

Associated data