. 2014 Mar:88:79-90.
doi: 10.1016/j.neuroimage.2013.11.027. Epub 2013 Nov 21.

Spurious group differences due to head motion in a diffusion MRI study

Affiliations

Spurious group differences due to head motion in a diffusion MRI study

Anastasia Yendiki et al. Neuroimage. 2014 Mar.

Abstract

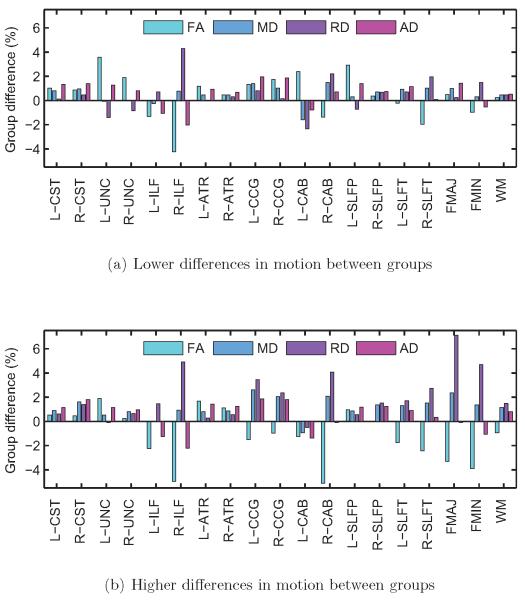
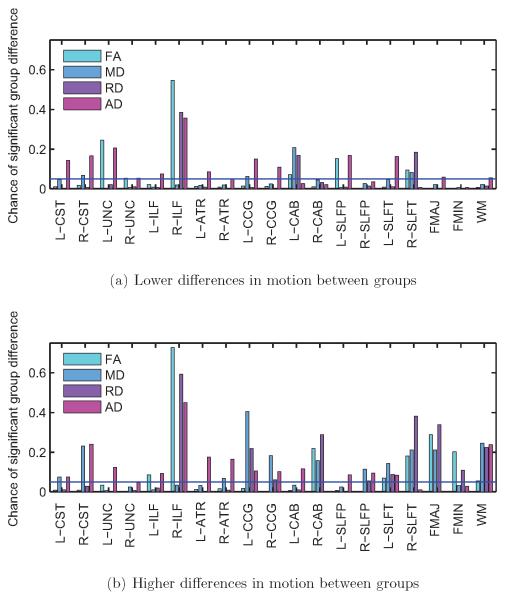
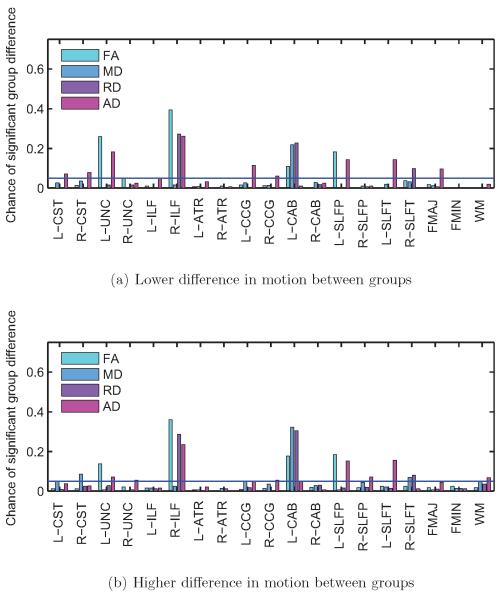
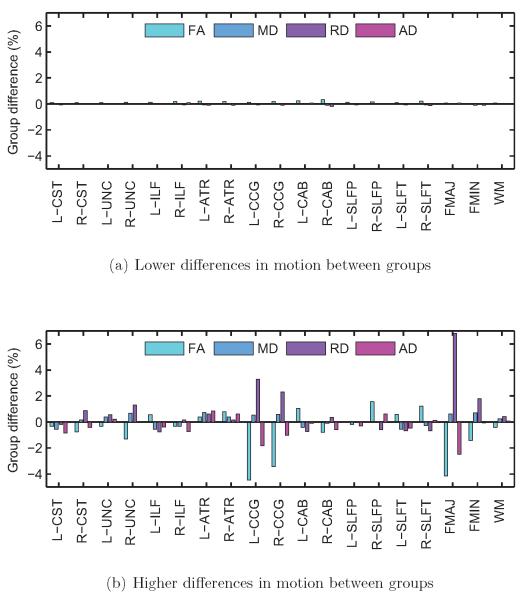
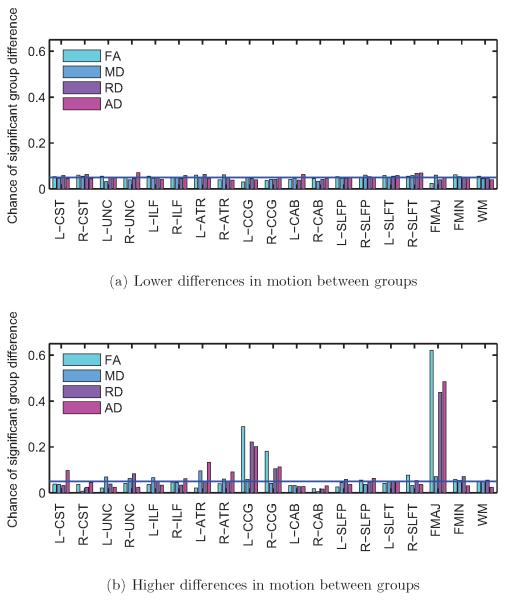
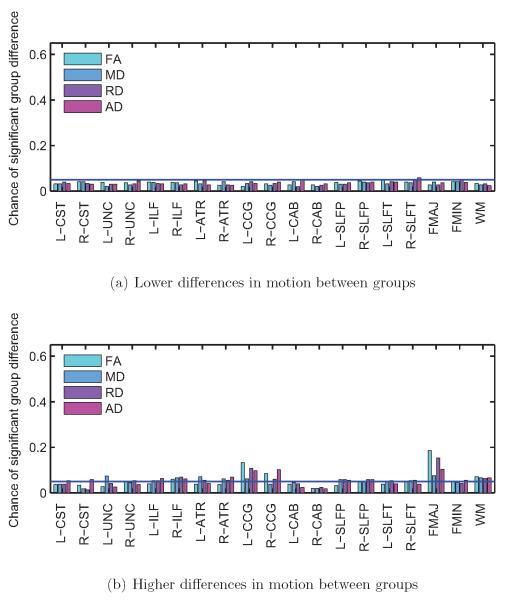
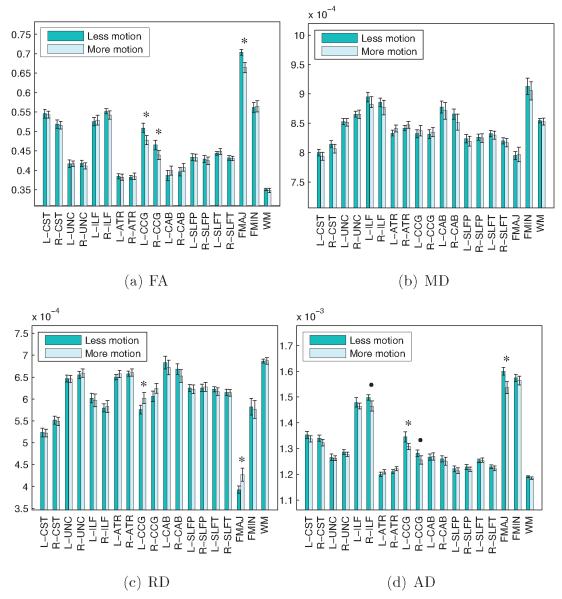
Diffusion-weighted MRI (DW-MRI) has become a popular imaging modality for probing the microstructural properties of white matter and comparing them between populations in vivo. However, the contrast in DW-MRI arises from the microscopic random motion of water molecules in brain tissues, which makes it particularly sensitive to macroscopic head motion. Although this has been known since the introduction of DW-MRI, most studies that use this modality for group comparisons do not report measures of head motion for each group and rely on registration-based correction methods that cannot eliminate the full effects of head motion on the DW-MRI contrast. In this work we use data from children with autism and typically developing children to investigate the effects of head motion on differences in anisotropy and diffusivity measures between groups. We show that group differences in head motion can induce group differences in DW-MRI measures, and that this is the case even when comparing groups that include control subjects only, where no anisotropy or diffusivity differences are expected. We also show that such effects can be more prominent in some white-matter pathways than others, and that they can be ameliorated by including motion as a nuisance regressor in the analyses. Our results demonstrate the importance of taking head motion into account in any population study where one group might exhibit more head motion than the other.

Keywords: Autism; Diffusion MRI; Motion; Tractography.


Figures

Figure 1
Figure 1. WM pathways reconstructed by TRACULA
ATR: anterior thalamic radiations; CAB: cingulum - angular bundle; CCG: cingulum - cingulate gyrus bundle; CST: corticospinal tract; FMAJ: corpus callosum - forceps major; FMIN: corpus callosum - forceps minor; ILF: inferior longitudinal fasciculus; SLFP: superior longitudinal fasciculus - parietal terminations; SLFT: superior longitudinal fasciculus - temporal terminations; UNC: uncinate fasciculus.
Figure 2
Figure 2. Overview of motion measures
Histograms of the four motion measures are shown for the 148 scans that were included in our analyses (green) and 17 scans that were excluded due to excessive motion (black).
Figure 3
Figure 3. Motion measures by group
The four motion measures are plotted for the 148 scans that were included in the analyses. Median motion measures (black dots) were higher for children with ASD than for TD children.
Figure 4
Figure 4. Subjects with autism vs. control subjects
The difference in motion measures between groups of 30 children with ASD and 30 age-matched TD children, plotted against the number of pathways that exhibited significant FA differences between the ASD and TD group at the p < 0.05 level. Averages and standard error bars are shown for each of the four motion measures, over a total of 50,000 randomly drawn subject combinations. On average, the greater the difference in motion between the ASD and TD group, the greater the number of pathways with significant FA differences.
Figure 5
Figure 5. Subjects with autism vs. control subjects
Group differences in FA, MD, RD, and AD, for each of the 18 pathways reconstructed by TRACULA and for the entire WM, averaged over 500 trials with low differences in motion (a) and 500 trials with high differences in motion between groups (b). Differences in DW-MRI measures are expressed as 100 · (xASDxTD)/xTD, where xASD and xTD are the measures for the ASD and TD group, respectively. There were greater group differences in DW-MRI measures for some pathways when the group differences in motion were higher.
Figure 6
Figure 6. Subjects with autism vs. control subjects
Frequency of significant group differences in FA, MD, RD, and AD at the p < 0.05 level, for each of the 18 pathways reconstructed by TRACULA and for the entire WM. Results are shown for 500 trials with low differences in motion (a) and 500 trials with high differences in motion between groups (b). The horizontal blue line indicates the type-I error rate of 0.05. Some pathways showed group differences in DW-MRI measures more frequently when the group differences in motion were higher.
Figure 7
Figure 7. Subjects with autism vs. control subjects, regressing motion
Frequency of significant group differences in FA, MD, RD, and AD at the p < 0.05 level, for each of the 18 pathways reconstructed by TRACULA and for the entire WM. Results are shown for 500 trials with low differences in motion (a) and 500 trials with high differences in motion between groups (b). The horizontal blue line indicates the type-I error rate of 0.05. Introducing the motion regressor led to similar results between trials with low and high group differences in motion.
Figure 8
Figure 8. Control subjects only
Group differences in FA, MD, RD, and AD, for each of the 18 pathways reconstructed by TRACULA and for the entire WM, averaged over 500 trials with low differences in motion (a) and 500 trials with high differences in motion between groups (b). Differences in DW-MRI measures are expressed as 100 · (xTD2xTD1)/xTD1, where xTD1 and xTD2 are the measures for the TD group with less and more motion, respectively. There were group differences in DW-MRI measures for some pathways, only when the group differences in motion were higher.
Figure 9
Figure 9. Control subjects only
False positive rates for FA, MD, RD, and AD at the p < 0.05 level, for each of the 18 pathways reconstructed by TRACULA and for the entire WM. Results are shown for 500 trials with low differences in motion (a) and 500 trials with high differences in motion between groups (b). The horizontal blue line indicates the type-I error rate of 0.05. False positive rates increased for some pathways when the group differences in motion increased.
Figure 10
Figure 10. Control subjects only, regressing motion
False positive rates for FA, MD, RD, and AD at the p < 0.05 level, for each of the 18 pathways reconstructed by TRACULA and for the entire WM. Results are shown for 500 trials with low differences in motion (a) and 500 trials with high differences in motion between groups (b). The horizontal blue line indicates the type-I error rate of 0.05. Introducing the motion regressor led to similar false positive rates between trials with low and high group differences in motion.
Figure 11
Figure 11. Subjects with test-retest scans
Mean FA, MD, RD, and AD for each of the 18 pathways reconstructed by TRACULA and for the entire WM are plotted for the lower- and higher-motion scans of the same 25 children. Group averages and standard error bars are shown. An asterisk indicates a significant difference in FA between groups (p < 0.05) and a disk indicates a trend towards significance (p < 0.1) based on a paired T -test. Significant group differences were found between test and retest scans of the same children, particularly in the corpus callosum and cingulum bundle.

References

    1. Aksoy MM, Forman CC, Straka MM, Skare SS, Holdsworth SS, Hornegger JJ, Bammer RR. Real-time optical motion correction for diffusion tensor imaging. Magnetic resonance in medicine. 2011 Aug;66(2):366–378. - PMC - PubMed
    1. Alhamud A, Tisdall MD, Hess AT, Hasan KM, Meintjes EM, van der Kouwe AJW. Volumetric navigators for real-time motion correction in diffusion tensor imaging. Magnetic resonance in medicine. 2012 Oct;68(4):1097–1108. - PMC - PubMed
    1. Anderson AW, Gore JC. Analysis and correction of motion artifacts in diffusion weighted imaging. Magnetic resonance in medicine. 1994 Sep;32(3):379–387. - PubMed
    1. Andersson JLR, Skare S. A model-based method for retrospective correction of geometric distortions in diffusion-weighted EPI. NeuroImage. 2002 May;16(1):177–199. - PubMed
    1. Behrens TEJ, Berg HJ, Jbabdi S, Rushworth MFS, Woolrich MW. Probabilistic diffusion tractography with multiple fibre orientations: What can we gain? NeuroImage. 2007 Jan;34(1):144–55. - PMC - PubMed