Review
. 2014 Feb;108(1):3-10.
doi: 10.1016/j.jphysparis.2013.10.001. Epub 2013 Nov 21.

Mapping the primate lateral geniculate nucleus: a review of experiments and methods

Affiliations
Review

Mapping the primate lateral geniculate nucleus: a review of experiments and methods

Ailsa M Jeffries et al. J Physiol Paris. 2014 Feb.

Abstract

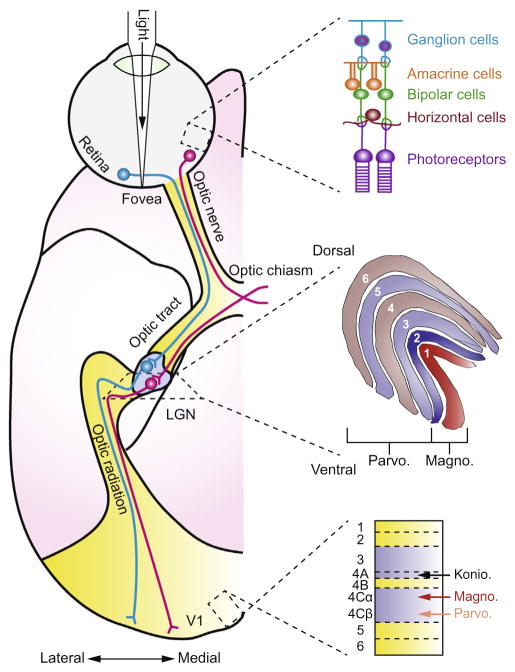
Mapping neuronal responses in the lateral geniculate nucleus (LGN) is key to understanding how visual information is processed in the brain. This paper focuses on our current knowledge of the dynamics the receptive field (RF) as broken down into the classical receptive field (CRF) and the extra-classical receptive field (ECRF) in primate LGN. CRFs in the LGN are known to be similar to those in the retinal ganglion cell layer in terms of both spatial and temporal characteristics, leading to the standard interpretation of the LGN as a relay center from retina to primary visual cortex. ECRFs have generally been found to be large and inhibitory, with some differences in magnitude between the magno-, parvo-, and koniocellular pathways. The specific contributions of the retina, thalamus, and visual cortex to LGN ECRF properties are presently unknown. Some reports suggest a retinal origin for extra-classical suppression based on latency arguments and other reports have suggested a thalamic origin for extra-classical suppression. This issue is complicated by the use of anesthetized animals, where cortical activity is likely to be altered. Thus further study of LGN ECRFs is warranted to reconcile these discrepancies. Producing descriptions of RF properties of LGN neurons could be enhanced by employing preferred naturalistic stimuli. Although there has been significant work in cats with natural scene stimuli and noise that statistically imitates natural scenes, we highlight a need for similar data from primates. Obtaining these data may be aided by recent advancements in experimental and analytical techniques that permit the efficient study of nonlinear RF characteristics in addition to traditional linear factors. In light of the reviewed topics, we conclude by suggesting experiments to more clearly elucidate the spatial and temporal structure of ECRFs of primate LGN neurons.

Keywords: CRF; EC; ECI; ECRF; Early visual system; Extra-classical receptive field; K; LGN; M; MID; Maximally Informative Dimensions; P; Parvocellular; RF; RGC; Reverse correlation; STA; STC; Thalamus; V1; classical receptive field; extra-classical; extra-classical inhibition; extra-classical receptive field; koniocellular; lateral geniculate nucleus; magnocellular; primary visual cortex; receptive field; retinal ganglion cell; spike-triggered average; spike-triggered covariance.


Figures

Fig. 1
Fig. 1
Early visual system pathways of the macaque monkey. The figure on the left shows the pathway of visual information imaged on the retina as it passes through the LGN and arrives at the primary visual cortex (V1). The anatomical schematic represents a ventral view of the right hemisphere. The visual scene is imaged by photoreceptors in the retina and information is passed through bipolar cells to retinal ganglion cells whose axons exit the back of the eyeball forming the optic nerve. Information from the contralateral part of the scene reaches the LGN with input from the two eyes arriving at separate layers of the LGN: layers 2, 3, and 5 receive input from the ipsilateral eye and layers 1, 4, and 6 receive input from the contralateral eye. The magnocellular layers (1 and 2) receive input that originated from rod photoreceptors and the Parvocellular layers (3–6) receive input that originated from cone photoreceptors. Koniocellular cells in the LGN are interspersed between the magnocellular and parvocellular layers and receive information arising from short-wavelength cones. Cells in the LGN project mainly to layer 4 of the primary visual cortex through a formation called the optic radiation. Adapted from Solomon and Lennie, 2007 with permission.
Fig. 2
Fig. 2
Classical and Extra-Classical Receptive Fields in the LGN. (A) The classical receptive field (CRF) comprises a central on or off region and a surrounding ring having the opposite sign. For on-center cells, light in the center excites the cell and light in the surround inhibits the cell; the reverse is true for off-center cells. Firing rate is approximately linearly determined by weighting the light in the center and surround regions. (B) The CRF can be modeled as the sum of two Gaussians, shown in section through the center of the field, a narrower excitatory region shown in red and a broader inhibitory one shown in blue for the example on cell here. The sum of the two is in black, and forms the well-known Mexican Hat profile. (C) The same difference of Gaussians is shown in a full two dimensional plot where color ranges from deep red for excitatory, through white for indifferent, and deep blue for inhibitory. Since the inhibitory field is not as strong as the excitatory field, it does not reach into deep blues, but remains at lighter ones. (D) The ECRF is an as-yet poorly defined region that is larger than the CRF, and is shown here in hatched gray. The reader should note that the ECRF may also extend through the area of visual space in which the CRF resides. Stimuli in the ECRF modulate the response to stimuli in the CRF, but without being able to directly generate spikes. Current thought holds that the ECRF provides contrast-dependent gain control on CRF sensitivity.
Fig. 3
Fig. 3
Typical Mapping Paradigm. The standard mapping paradigm used to measure response fields (RFs) in primates places a computer monitor at a fixed distance in front of the subject and displays mapping stimuli while neural signals are recorded. Experiments include a sequence of phases that are presented in order, as shown in this figure. Prior to stimulus presentation, the gaze is localized to a known point on the screen (PRE-MAP) which will also bring the putative RF of the cell under study to a known location, relative to the fixation point. A series of mapping stimuli, depicted here as a set of black-and-white random checkerboards, is then shown as the neural response is captured (MAPPING). Often a brief quiet period is included after the stimulus ends before the recording concludes (POST-MAP). For awake preparations especially, the Mapping phase can be brief, and the sequence repeated many times with different temporal segments of the mapping stimuli to build up an aggregate set of data. When the location of the RF is not known a-priori, a sequence of mappings can be made that starts with checkerboards with large squares, and progresses to finer checkerboards, spanning progressively smaller portions of the visual field while providing increasingly fine detail. Complete mapping of an RF may require many thousands of checkerboard frames, although a single set of frames is often re-used from one neuron to the next.
Fig. 4
Fig. 4
RF Extraction via Spike Triggered Averaging. The simplest methods to compute the RF from a recording use the Spike Triggered Averaging (STA) technique. This method and its variants rely upon the independence between signal and noise, and presume that at any given instance that the cell responds by firing a spike, there is some commonality among the stimuli presented that have elicited each spike. The commonality is interpreted as being descriptive of the linear portion of the RF, whereas non-commonalities in the stimuli will tend to average to zero for well-constructed stimuli. (A) A sequence of 5-by-5 checkerboards in temporal order along with an extracted spike train. Stimuli of practical use have many more squares than the reduced version shown here. Frames where a spike was detected are highlighted with a light gray box and labeled with lower case letters starting with a. (B) Labeled frames are collected, averaged, and normalized to form a map, shown here in snapshots with 1, 2, 5, etc. spikes detected to depict the evolution of the computation with an according number of checkerboards. Maps are shown on a scale where deep red represents response to white squares of the checkerboard, white indicates indifference to the stimulus, and deep blue represents response to black squares of the checkerboard. The map that is computed depicts the response of an on-center cell. Not shown is the extension of this technique to examine frames that immediately preceded each spike: the computation is run multiple times with differing temporal offsets between spike and selected frames, generating a movie of the optimal stimulus.

References

    1. Alitto HJ, Moore BD, Rathbun DL, Usrey WM. A comparison of visual responses in the lateral geniculate nucleus of alert and anaesthetized macaque monkeys. J Physiol. 2011;589:87–99. - PMC - PubMed
    1. Alitto HJ, Usrey WM. Origin and dynamics of extraclassical suppression in the lateral geniculate nucleus of the macaque monkey. Neuron. 2008;57:135–146. - PMC - PubMed
    1. Alivisatos AP, Chun M, Church GM, Greenspan RJ, Roukes ML, Yuste R. The brain activity map project and the challenge of functional connectomics. Neuron. 2012;74:970–974. - PMC - PubMed
    1. Angelucci A, Bressloff PC. Contribution of feedforward, lateral and feedback connections to the classical receptive field center and extra-classical receptive field surround of primate V1 neurons. Prog Brain Res. 2006:93–120. - PubMed
    1. Babadi B, Casti A, Xiao Y, Kaplan E, Paninski L. A generalized linear model of the impact of direct and indirect inputs to the lateral geniculate nucleus. J Vis. 2010;10(22):1–14. - PMC - PubMed

Publication types

LinkOut - more resources