. 2014 Feb 25;129(8):864-74.
doi: 10.1161/CIRCULATIONAHA.113.004581. Epub 2013 Nov 22.

Mammalian target of rapamycin complex 2 (mTORC2) coordinates pulmonary artery smooth muscle cell metabolism, proliferation, and survival in pulmonary arterial hypertension

Affiliations

Mammalian target of rapamycin complex 2 (mTORC2) coordinates pulmonary artery smooth muscle cell metabolism, proliferation, and survival in pulmonary arterial hypertension

Dmitry A Goncharov et al. Circulation. .

Abstract

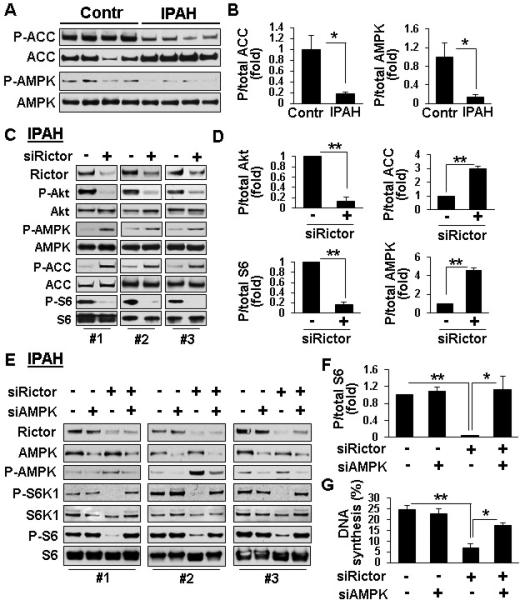
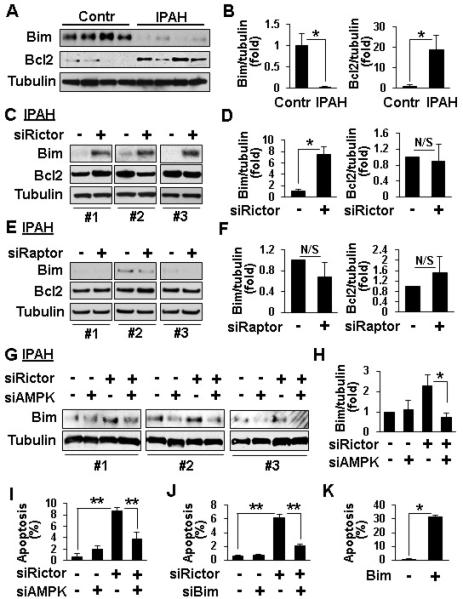
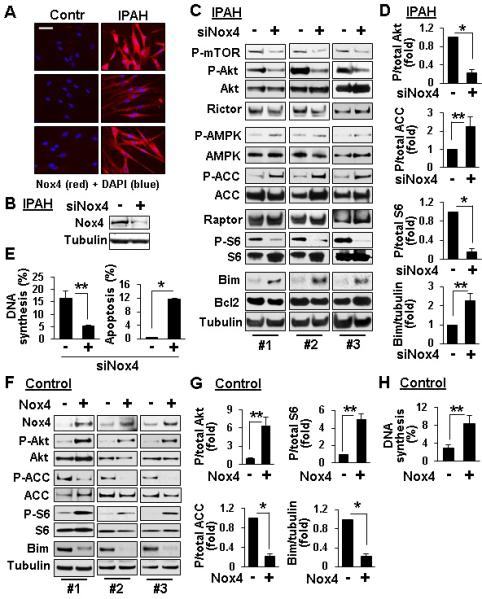
Background: Enhanced proliferation, resistance to apoptosis, and metabolic shift to glycolysis of pulmonary arterial vascular smooth muscle cells (PAVSMCs) are key pathophysiological components of pulmonary vascular remodeling in idiopathic pulmonary arterial hypertension (PAH). The role of the distinct mammalian target of rapamycin (mTOR) complexes mTORC1 (mTOR-Raptor) and mTORC2 (mTOR-Rictor) in PAVSMC proliferation and survival in PAH and their therapeutic relevance are unknown.

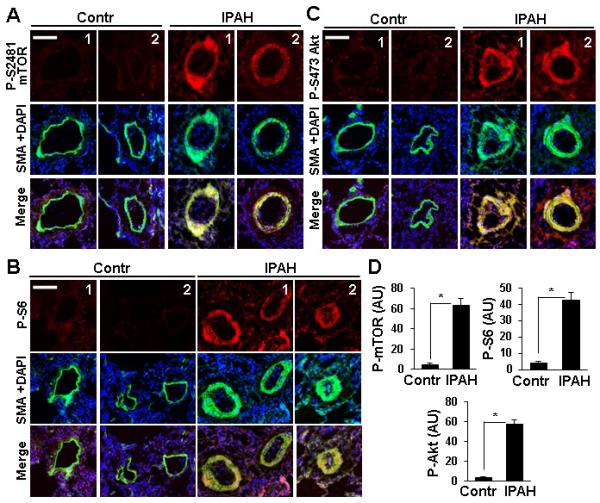
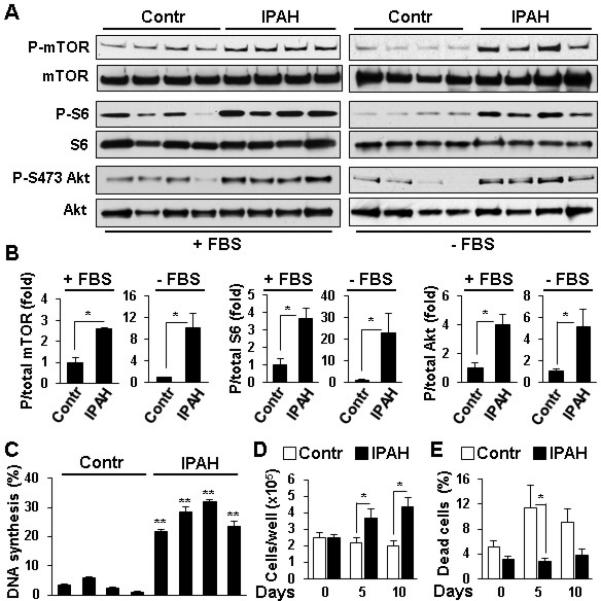
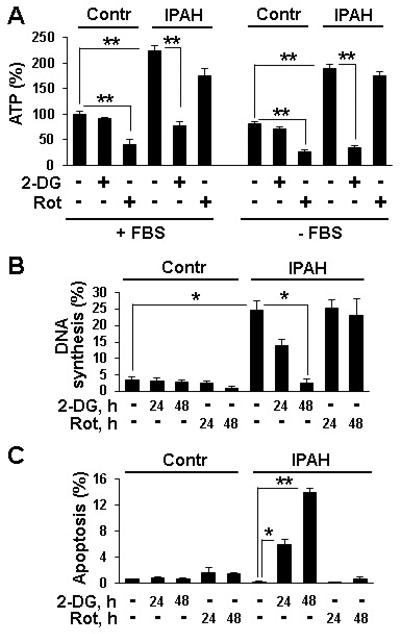
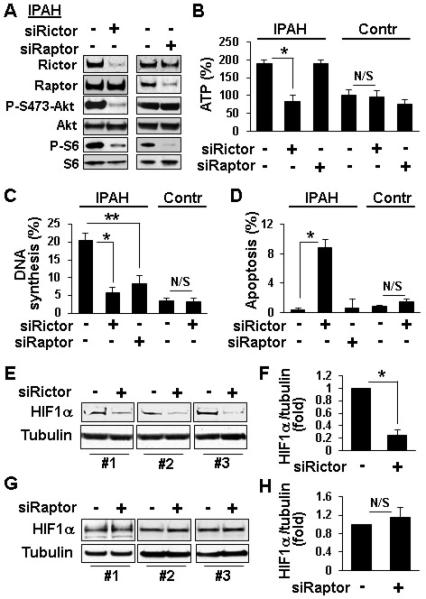
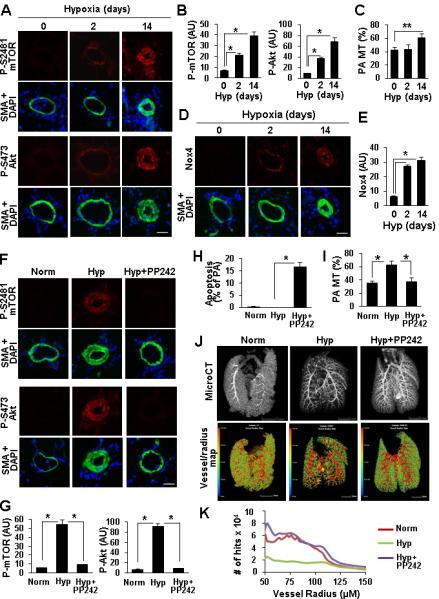
Methods and results: Immunohistochemical and immunoblot analyses revealed that mTORC1 and mTORC2 pathways are markedly upregulated in small remodeled pulmonary arteries and isolated distal PAVSMCs from subjects with idiopathic PAH that have increased ATP levels, proliferation, and survival that depend on glycolytic metabolism. Small interfering RNA- and pharmacology-based analysis showed that although both mTORC1 and mTORC2 contribute to proliferation, only mTORC2 is required for ATP generation and survival of idiopathic PAH PAVSMCs. mTORC2 downregulated the energy sensor AMP-activated protein kinase, which led to activation of mTORC1-S6 and increased proliferation, as well as a deficiency of the proapoptotic protein Bim and idiopathic PAH PAVSMC survival. NADPH oxidase 4 (Nox4) protein levels were increased in idiopathic PAH PAVSMCs, which was necessary for mTORC2 activation, proliferation, and survival. Nox4 levels and mTORC2 signaling were significantly upregulated in small pulmonary arteries from hypoxia-exposed rats at days 2 to 28 of hypoxia. Treatment with the mTOR kinase inhibitor PP242 at days 15 to 28 suppressed mTORC2 but not Nox4, induced smooth muscle-specific apoptosis in small pulmonary arteries, and reversed hypoxia-induced pulmonary vascular remodeling in rats.

Conclusions: These data provide a novel mechanistic link of Nox4-dependent activation of mTORC2 via the energy sensor AMP-activated protein kinase to increased proliferation and survival of PAVSMCs in PAH, which suggests a new potential pathway for therapeutic interventions.

Keywords: AMP-activated protein kinase; energy metabolism; idiopathic pulmonary arterial hypertension; mTORC2; muscle, smooth, vascular; remodeling; signal transduction.


Figures

Figure 1
Figure 1
mTORC1 and mTORC2 pathways are activated in small PAs from IPAH lungs. Dual immunohistochemical analysis with anti-P-S2481-mTOR, anti-P-S6, anti-P-S473-Akt (red) and anti-SMA antibodies (green) and DAPI staining (blue) to detect nuclei of lung tissue specimens from four IPAH and four control subjects. A-C: Images were taken on a Nikon Eclipse 2000 microscope. Bar equals 100 μM. D: Statistical analysis of P-proteins in SMA-positive areas in small PAs from IPAH and control lungs. Data represent arbitrary units (AU). 4 human subjects/group; *p<0.01 by unpaired Student's t-test.
Figure 2
Figure 2
PAVSMC from IPAH lungs have activated mTORC1 and mTORC2 signaling, increased proliferation and survival. A,B: Distal PAVSMC from four non-diseased (control) and four IPAH subjects cultured in complete media (+FBS) or serum-deprived for 48 h (−FBS) were subjected to immunoblot analysis to detect indicated proteins. Data represent fold changes in P/total protein ratios; P/total ratio for controls taken as one fold. 4 subjects/group; *p<0.05 by unpaired Student t-test. C: DNA synthesis analysis of serum-deprived for 48 h PAVSMC (BrdU incorporation) from four control and four IAPH subjects, 3 measurements/subject, data from each subject presented as a separate bar. Data represent percentage of BrdU-positive cells per total number of cells. **p<0.001 vs. controls by unpaired Student t-test. D,E: Cell counts and viability of PAVSMC from four IPAH (squares) and four control subjects (circles) maintained in serum-free conditions. Data represent quantity of cells/well (D) and percentage of dead cells/total number of cells (E). 4 subjects/group; *p<0.05 by unpaired Student t-test.
Figure 3
Figure 3
Increased ATP levels, proliferation and survival of IPAH PAVSMC depend on glycolytic metabolism. A: ATP assay performed on PAVSMC from three control and three IPAH subjects maintained in complete media (+FBS) or serum-deprived for 48 h (−FBS) and treated with 100 mM 2-DG, 10 μM rotenone or diluent for 24 h. ATP levels in control diluent-treated cells in complete media are taken as 100%. 3 subjects/group; **p<0.01 by 2-way ANOVA with a post hoc stratified independent t-test with corrections for multiple comparisons. B,C: DNA synthesis (B) and apoptosis analysis (C) of serum-deprived for 48 h cells treated with 100 mM 2-DG, 10 μM rotenone or diluent. Data represent percentage of BrdU-positive (B) (4 subjects/group) or TUNEL-positive cells (C) (3 subjects/group) per total number of cells. *p<0.05, **p<0.01 by 3-way ANOVA (IPAH/control, treatment, time) with a post hoc stratified independent t-test with corrections for multiple comparisons.
Figure 4
Figure 4
A-D: mTORC2 is required for maintenance of increased ATP levels, proliferation and survival of IPAH PAVSMC. A, B: Serum-deprived for 48 h PAVSMC were transfected with 100 nM control scrambled (−), rictor and raptor siRNAs followed by immunoblot analysis to detect indicated proteins (A) and ATP assay (B). ATP levels in control cells transfected with control siRNA are taken as 100%. 3 subjects/group; *p<0.01 by 2-way ANOVA with a post hoc stratified independent t-test with corrections for multiple comparisons. C,D: Serum-deprived for 48 h PAVSMC from IPAH and control subjects transfected with 100 nM control scrambled siRNA (−),rictor and raptor siRNAs were subjected to DNA synthesis (BrdU incorporation) (C) and apoptosis analysis (TUNEL) (D). Data are percentage of BrdU-positive (C) or TUNEL-positive cells (D) from total number of cells. 3 subjects/group; N/S - non-significant, *p<0.01 by 2-way ANOVA with a post hoc stratified independent t-test with corrections for multiple comparisons; **p<0.05 by unpaired Student t-test. E-H: siRNA rictor, but not siRNA raptor, decreases HIF1 α protein levels in IPAH PAVSMC. Serum-deprived for 48 h PAVSMC from three IPAH subjects were transfected with 100 nM control scrambled (−), rictor (E,F) or raptor (G,H) siRNAs followed by immunoblot analysis. Data represent fold changes in HIF1α/tubulin ratios; ratios for control siRNA-transfected cells taken as one fold. 3 subjects/group; N/S - non-significant, *p<0.001 by unpaired Student's t-test.
Figure 5
Figure 5
mTORC2 regulates mTORC1 signaling and IPAH PAVSMC proliferation via AMPK. A,B: Immunoblot analysis of serum-deprived for 48 h PAVSMC from four IPAH and four control subjects performed to detect indicated proteins. Data represent P/total protein ratios; mean ratio for control PAVSMC was taken as one fold. 4 subjects/group, *p<0.05 by unpaired Student's t-test. C-G: Serum-deprived PAVSMC from three IPAH subjects were transfected for 48 h with 100 nM rictor or control scrambled (−) siRNAs (C,D) or co-transfected with 50 nM siRNA rictor, siRNA AMPK, or control scrambled siRNA (−) (E-G) followed by immunoblot (C-F) and DNA synthesis (BrdU incorporation) (G) analyses. Data represent fold changes in P/total protein ratios; ratio for control siRNA-transfected cells taken as one fold (D,F) and percentage of BrdU-positive cells from total number of cells (G). D: 3 subjects/group; **p≤0.001 by unpaired Student t-test. F,G: 4 (F) and 3 (G) subjects/group; *p<0.05, **p≤0.001 by one-way ANOVA with a post hoc Dunnett's test.
Figure 6
Figure 6
siRNA rictor regulates Bim protein levels and apoptosis via AMPK. A, B: Immunoblot analysis of serum-deprived for 48 h PAVSMC from four non-diseased (control) and four IPAH lungs. 4 subjects/group, *p<0.01 by unpaired Student t-test. C-F: Immunoblot analysis of serum-deprived for 48 h PAVSMC from three IPAH subjects transfected with 100 nM control scrambled siRNA (−), siRNA rictor, or siRNA raptor. 3 subjects/group, *p<0.05, N/S - non-significant by unpaired Student t-test. G-J: Serum-deprived for 48 h IPAH PAVSMC were transfected with 50 nM siRNA rictor, siRNA AMPK, siRNA Bim or control scrambled siRNA (−) separately or in combination followed by immunoblot (G,H) and apoptosis assay (I,J). 3 subjects/group, *p<0.05, **p<0.01 by one-way ANOVA with a post hoc Dunnett's test. K: Apoptosis analysis of IPAH PAVSMC from three subjects transfected with pCMV6-Bim (Bim) or mock-transfected (−). 3 subjects/group, *p<0.001 by unpaired Student t-test. Data represent Bim/tubulin or Bcl2/tubulin ratios with ratio for scrambled siRNA-transfected cells taken as one fold (B,D,F,H) and percentage of TUNEL-positive cells per total number of cells (I,J).
Figure 7
Figure 7
Nox4 contributes to up-regulation of mTORC2 signaling, PAVSMC proliferation and survival. A: Immunostaining with anti-Nox4 antibody (red) and DAPI nuclear staining (blue) performed on PAVSMC from three control and three IPAH subjects. Representative images were taken using a Nikon Eclipse 2000 microscope. Bar equals 50 μM. B-E: Immunoblot (B-D), DNA synthesis (BrdU incorporation) and apoptosis (TUNEL) analysis (E) of serum-deprived PAVSMC from IPAH subjects transfected for 48 h with siRNA Nox4 or scrambled siRNA (−). F-H: Immunoblot (F,G) and DNA synthesis (BrdU incorporation) analysis (H) of serum-deprived for 48 h PAVSMC from non-diseased subjects transfected with pCMV6-Myc-DDK Nox4 or mock-transfected (−). Data represent fold changes in phospho/total Akt, ACC, or S6, and Bim/tubulin ratios, ratios of control siRNA- (D) or mock-transfected cells (G) taken as one fold; and percentage of BrdU- (E,H) or TUNEL-positive cells (E) per total number of cells. Data are mean+SE from 3 subjects/group for E, D, G and 4 subjects/group for H; *p<0.001, **p<0.05 by unpaired Student t-test.
Figure 8
Figure 8
mTOR is required for PAVSMC survival and pulmonary vascular remodeling in rat chronic hypoxia PH model. A-E: Lung tissue sections from 6-8-week-old male Sprague-Dawley rats maintained under chronic hypoxia for 0, 2, 14 days were subjected to immunohistochemical (A,B,D,E) and PA medial wall thickness (MT) (C) analyses. B: 3 rats/group; C: 6 rats/group; *p<0.01, **p<0.05, by one-way ANOVA with a post hoc Dunnett's test. F-K: Immunohistochemical (F,G), apoptosis (H), PA medial wall thickness (MT) (I) and microCT (J,K) analyses performed on the lungs from rats maintained under normoxia or exposed to chronic hypoxia for 28 days and treated with PP242 or vehicle at days 15-28 of hypoxia. A, D, F: Bar equals 50 μM. B,E,G: Data represent arbitrary units (AU). H: Data represent % of small PAs with SM-specific apoptosis from total number of small PAs. G, H: 3 rats/group; I: 6 rats/group; *p<0.01 by one-way ANOVA with a post hoc Dunnett's test. J, K: Representative images of microCT analysis using μCT40 microCT scanner (J, top panel) and hit maps generated on the basis of microCT analysis using VHLab and SCIRun software (J, bottom panel). Bar equals 5 mm. K: Data represent number of hits/vessel radius.

Similar articles

Cited by

References

    1. Morrell NW, Adnot S, Archer SL, Dupuis J, Jones PL, MacLean MR, McMurtry IF, Stenmark KR, Thistlethwaite PA, Weissmann N, Yuan JXJ, Weir EK. Cellular and Molecular Basis of Pulmonary Arterial Hypertension. J Am Coll Cardiol. 2009;54:S20–S31. - PMC - PubMed
    1. Archer SL, Gomberg-Maitland M, Maitland ML, Rich S, Garcia JGN, Weir EK. Mitochondrial metabolism, redox signaling, and fusion: a mitochondria-ROS-HIF-1α-Kv1.5 O2-sensing pathway at the intersection of pulmonary hypertension and cancer. Am J Physiol Heart Circ Physiol. 2008;294:H570–H578. - PubMed
    1. Masri FA, Xu W, Comhair SAA, Asosingh K, Koo M, Vasanji A, Drazba J, Anand-Apte B, Erzurum SC. Hyperproliferative apoptosis-resistant endothelial cells in idiopathic pulmonary arterial hypertension. Am J Physiol Lung Cell Mol Physiol. 2007;293:L548–L554. - PubMed
    1. Das M, Dempsey EC, Bouchey D, Reyland ME, Stenmark KR. Chronic Hypoxia Induces Exaggerated Growth Responses in Pulmonary Artery Adventitial Fibroblasts. Potential Contribution of Specific Protein Kinase C Isozymes. Am J Respir Cell Mol Biol. 2000;22:15–25. - PubMed
    1. Tuder RM, Davis LA, Graham BB. Targeting Energetic Metabolism. Am J Respir Crit Care Med. 2012;185:260–266. - PMC - PubMed

Publication types

MeSH terms

Substances