. 2013 Dec;123(12):5389-400.
doi: 10.1172/JCI70317. Epub 2013 Nov 25.

Circadian clock proteins regulate neuronal redox homeostasis and neurodegeneration

Circadian clock proteins regulate neuronal redox homeostasis and neurodegeneration

Erik S Musiek et al. J Clin Invest. 2013 Dec.

Abstract

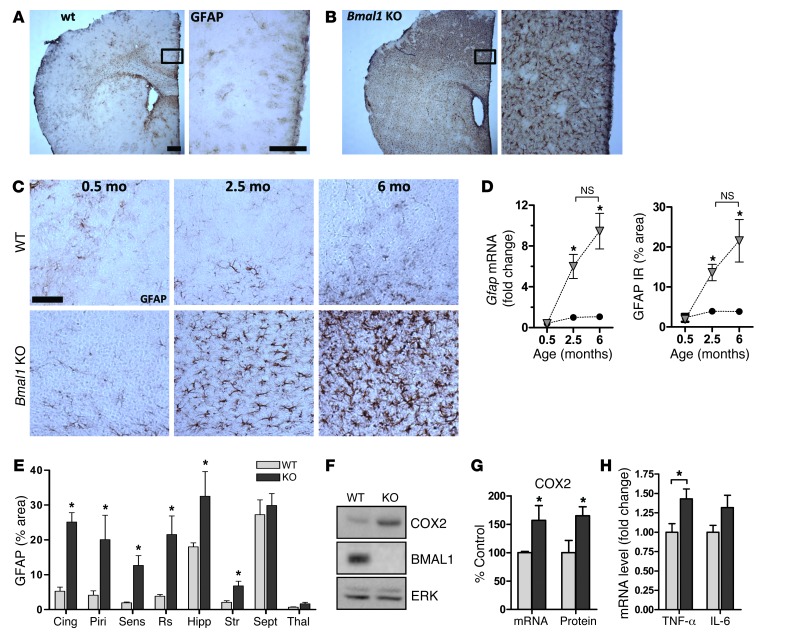
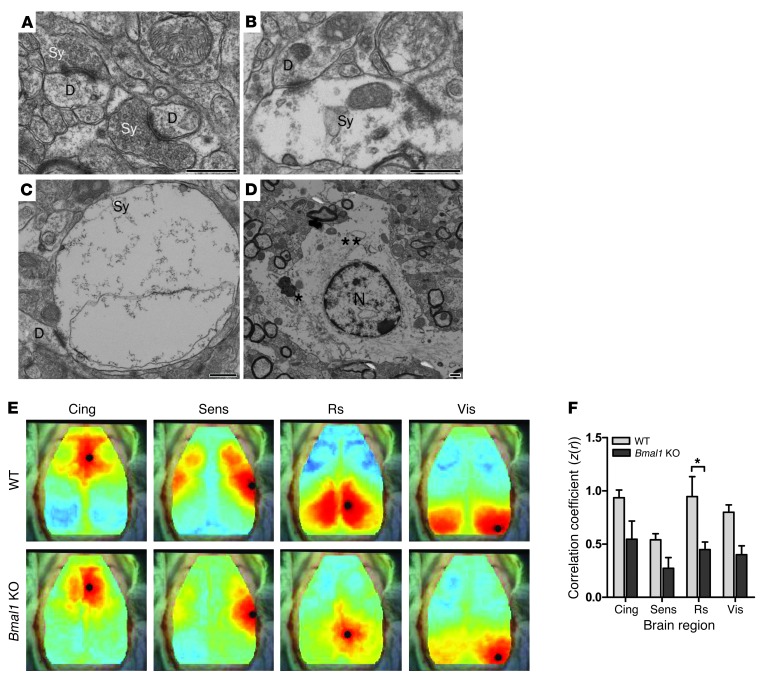
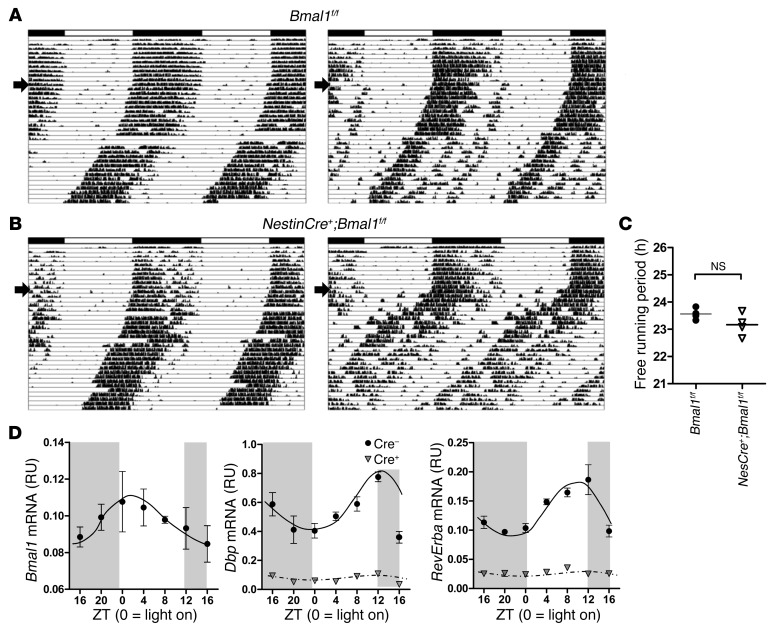
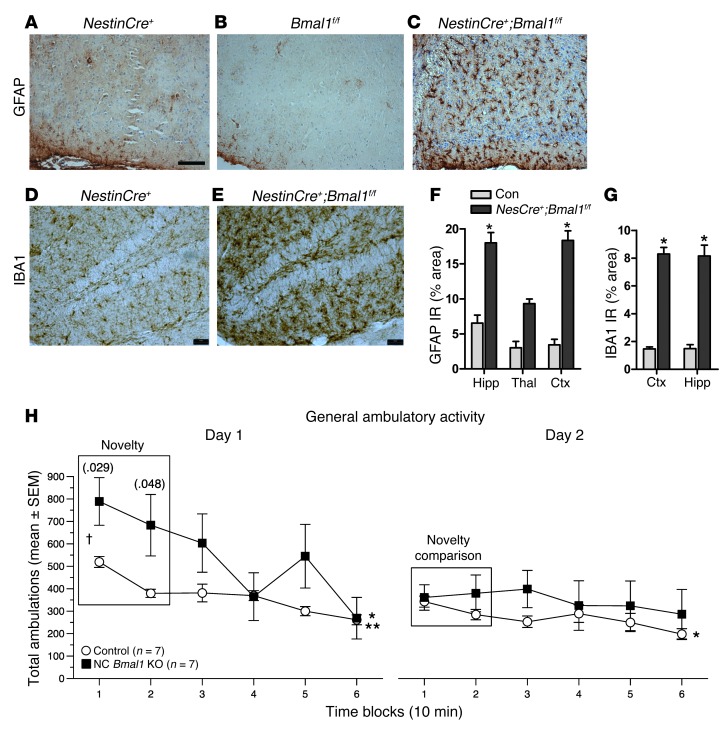
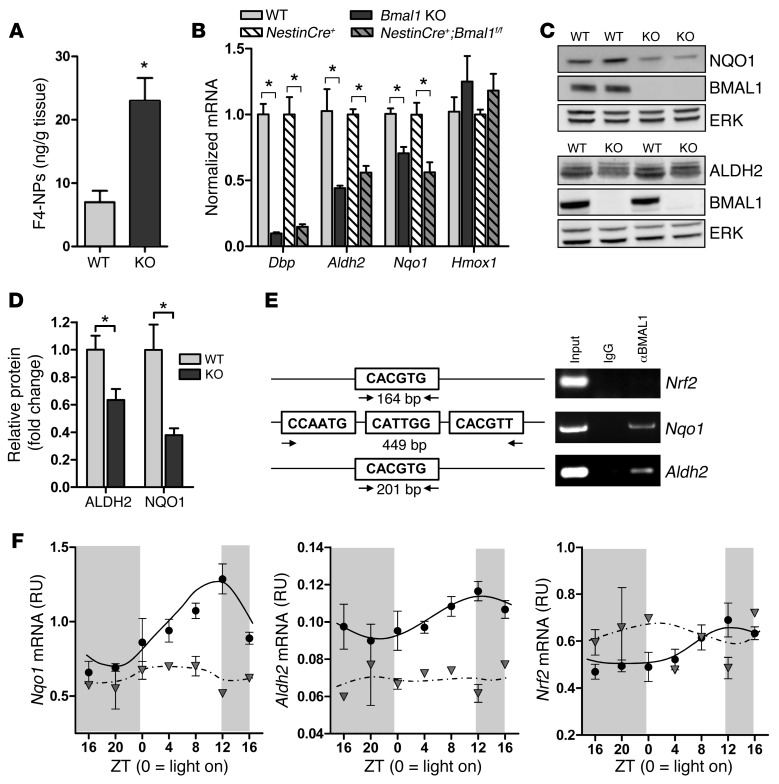
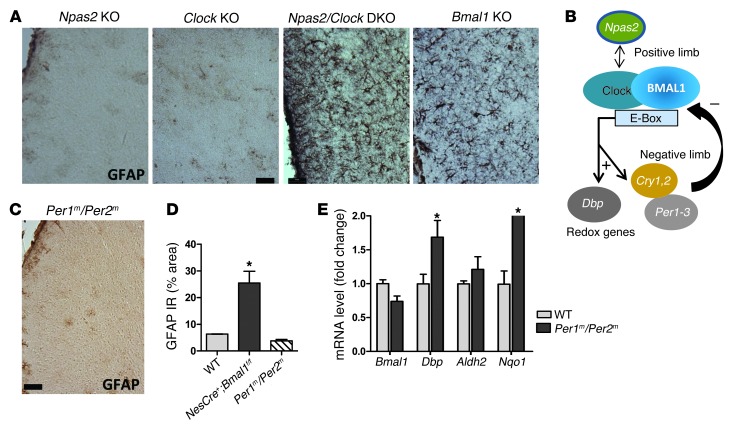
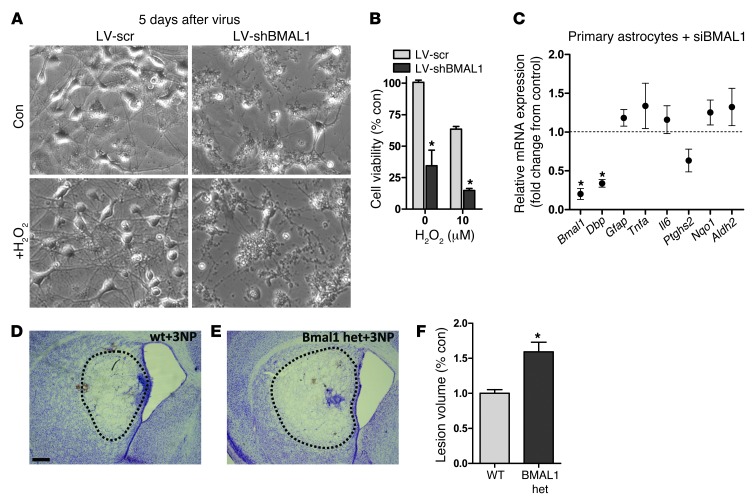
Brain aging is associated with diminished circadian clock output and decreased expression of the core clock proteins, which regulate many aspects of cellular biochemistry and metabolism. The genes encoding clock proteins are expressed throughout the brain, though it is unknown whether these proteins modulate brain homeostasis. We observed that deletion of circadian clock transcriptional activators aryl hydrocarbon receptor nuclear translocator-like (Bmal1) alone, or circadian locomotor output cycles kaput (Clock) in combination with neuronal PAS domain protein 2 (Npas2), induced severe age-dependent astrogliosis in the cortex and hippocampus. Mice lacking the clock gene repressors period circadian clock 1 (Per1) and period circadian clock 2 (Per2) had no observed astrogliosis. Bmal1 deletion caused the degeneration of synaptic terminals and impaired cortical functional connectivity, as well as neuronal oxidative damage and impaired expression of several redox defense genes. Targeted deletion of Bmal1 in neurons and glia caused similar neuropathology, despite the retention of intact circadian behavioral and sleep-wake rhythms. Reduction of Bmal1 expression promoted neuronal death in primary cultures and in mice treated with a chemical inducer of oxidative injury and striatal neurodegeneration. Our findings indicate that BMAL1 in a complex with CLOCK or NPAS2 regulates cerebral redox homeostasis and connects impaired clock gene function to neurodegeneration.


Figures

Figure 1
Figure 1. Marked age-dependent cerebral astroglial activation in Bmal1 KO mice.
GFAP staining of sections from 6-month-old WT (A) and Bmal1 KO (B) mice shows severe astrogliosis throughout the brain of KO mice and most severe in cortex. Scale bars: 200 μm. (C) GFAP staining of retrosplenial cortex sections from WT and KO mice at 2 weeks of age (0.5 months), 2.5 months, and 6 months of age demonstrates age-dependent astrogliosis, which is present by age 2.5 months. Scale bar: 100 μm (D) Quantification of Gfap mRNA by qPCR and GFAP immunoreaction (IR; % area) by immunostaining of cortex samples shows age-dependent increases in astrogliosis. qPCR was normalized to 18S mRNA levels and is expressed as fold change compared with 2.5-month-old WT control mice. Black circles represent WT mice, and gray triangles represent KO mice (n = 3 mice/point). *P < 0.05 by 1-way ANOVA versus 2-week-old WT mice. (E) Region-specific astrocyte activation in Bmal1 KO brain. Ten mice per genotype were stained for GFAP, while 3 mice per genotype were quantified. Cing, cingulate cortex; Piri, piriform cortex; Sens, sensory cortex; Rs, retrosplenial cortex; Hipp, hippocampus; Str, striatum; Sept, septum; Thal, thalamus. (F) Increased COX2 protein (F and G) and Ptghs2 mRNA (G) in 6-month-old Bmal1 KO cortex. (H) Increased Tnfa mRNA by qPCR in Bmal1 KO cortex. n = 4 mice/genotype (G and H). *P < 0.05 versus WT by 2-way ANOVA with Bonferroni’s post test.
Figure 2
Figure 2. Synaptic degeneration and impaired functional connectivity in Bmal1 KO cortex.
(AC). Electron micrographs showing presynaptic terminals (Sy) in 6-month-old WT (A) and Bmal1 KO (B and C) retrosplenial cortex. Note that in the Bmal1 KO cortex, the synaptic terminals are swollen and relatively devoid of synaptic vesicles, while the presynaptic and postsynaptic membranes, synaptic cleft, and dendritic spine (D) have normal morphology. Bmal1 KO mice showed both normal and abnormal terminals. (D) An activated astrocyte with a prominent Golgi complex (*) and islands of rough ER (**) around the nucleus (N). This cell is recognized by its abundance of intermediate filaments and cytoplasm with a lucent matrix. Activated astrocytes and numerous organelle-rich astrocytic processes were seen throughout the Bmal1 KO cortical tissue. Scale bars: 500 nm. (E) Composite functional connectivity maps from all mice generated using fcOIS. Shown are the seed locations (black circle) and the map of connectivity with that region (red indicates a positive correlation; blue indicates a negative correlation). (F) Connectivity (correlation coefficient z score) between corresponding contralateral cortical regions (n = 5 mice/genotype, all 6 months of age). Cing, cingulate; Sens, sensory; Rs, retrosplenial; Vis, visual. *P < 0.05 by 2-way ANOVA with Bonferroni’s post test.
Figure 3
Figure 3. Brain-specific deletion of Bmal1 disrupts circadian transcriptional regulation in cortex despite intact behavioral circadian rhythms.
(A and B) Actograms showing wheel-running activity in 3- to 4-month-old Bmal1flox/flox control mice (A) and NestinCre+;Bmal1f/f mice (B). Each panel shows data from a representative mouse, recorded for 10 days in a 12-hour light/12-hour dark cycle, then for 30 days in constant darkness (start of constant darkness denoted by arrow). (C) Free-running time for all mice analyzed in A (n = 4/genotype). There was no statistical difference between groups (mean = 23.56 hours for control and 23.17 hours for Nestin-Bmal1 mice; P = 0.14 by 2-tailed Student’s t test). (D) Circadian clock gene expression in cerebral cortex tissue from control (Bmal1f/f, Cre) and brain-specific Bmal1 KO mice (NestinCre;Bmal1f/f, Cre+; gray triangles). Mice were housed in constant darkness for 24 hours, then harvested every 4 hours. mRNA levels were quantified by qPCR and were normalized to 18S rRNA (n = 2–4 mice/genotype/time point). RU, relative units.
Figure 4
Figure 4. Brain-specific deletion of Bmal1 causes neuropathology and behavioral abnormalities.
GFAP staining shows marked astrocyte activation in the retrosplenial cortex of NestinCre+:Bmal1f/f mice (C), but not in NestinCre+ (A) or Bmal1f/f controls (B). Hippocampal microglial activation assessed by IBA1 immunoreactivity in a representative Cre+ control (D) and NestinCre+;Bmal1f/f mice (E). Scale bars: 200 μm. Quantification of GFAP (F) and IBA1 (G) immunoreactivity by percentage of area (n = 4 mice/genotype). *P < 0.05 versus control by 2-way ANOVA with Bonferroni’s post test. Ctx, cortex. (H) One-hour locomotor behavioral test reveals a significantly abnormal response to a novel environment in NestinCre+;Bmal1f/f mice (black squares) as compared with Bmal1f/f controls. Data for total ambulations are shown; similar data for vertical rearings are shown in Supplemental Figure 5. n = 7 mice/genotype. P values from repeated-measures ANOVA are displayed for novelty analysis. P < 0.05 for habituation analysis for both genotypes on day 1, but only for Bmal1f/f on day 2; *Bmal1f/f; **NestinCre+;Bmal1f/f.
Figure 5
Figure 5. Bmal1 deletion induces oxidative stress and redox defense gene dysregulation.
(A) Increased F4-NP levels as quantified by liquid chromatography tandem mass spectrometry (LC-MS/MS) in 6-month-old Bmal1 KO cortex, indicative of neuronal membrane lipid peroxidation (n = 5 mice/genotype). (B) Quantification of Dbp and redox gene expression in Bmal1 KO and NestinCre+;Bmal1f/f cortex versus controls at ZT 6 (n = 5–6 mice/genotype). Bmal1 KO values were normalized and compared with WT cortex, while NestinCre+;Bmal1f/f values were normalized and compared with NestinCre+ controls. (C) Representative Western blots showing decreased NQO1 (upper blots) and ALDH2 (lower blots) protein in Bmal1 KO brain at ZT 6. ERK is shown as a loading control. (D) Quantification of ALDH2 and NQO1 protein (n = 5 mice/genotype). Shown is the mean + SEM for all graphs. *P < 0.05 versus control by Student’s t test (A) or 2-way ANOVA with Bonferroni’s post test (B and D). (E) ChIP assay in WT mice at ZT 6 demonstrating that BMAL1 does not bind to a canonical E-box in the Nrf2 promoter, but does bind a noncanonical E-box in the Nqo1 promoter and a canonical E-box in the Aldh2 promoter. Total lysate (input, positive control) and immunoprecipitates prepared using nonspecific IgG (negative control) are shown. (F) BMAL1 regulates cortical expression of Nqo1 and Aldh2, but not Nrf2. Frontal cortex samples were collected every 4 hours from Bmal1f/f control mice (black circles) or NestinCre+;Bmal1f/f mice (gray triangles) as in Figure 3D, and redox genes were quantified by qPCR (n = 2–3 mice/time point/genotype).
Figure 6
Figure 6. Genetic disruption specifically of the positive limb of the circadian clock causes neuropathology.
(A) GFAP staining of retrosplenial cortex from 4-month-old Npas2 KO, Clock KO, Npas2/Clock DKO, and Bmal1 KO mice shows that complete disruption of the positive limb of the core clock (depicted in B) is required to elicit neuropathology. (C) Absence of astrogliosis in retrosplenial cortex from 4-month-old Per1m/Per2m mice, which lack negative limb clock function and have dysfunctional circadian oscillation. (D) Quantification of GFAP immunoreactivity in Per1m/Per2m mice (% area). NestinCre+;Bmal1f/f cortex is shown for comparison. (E) qPCR data from 4-month-old Per1m/Per2m cortex show a transcriptional profile opposite that of Bmal1 KO brain (see Figure 1). (D and E) n = 4 mice/genotype. *P < 0.05 versus control by 2-way ANOVA with Bonferroni’s post test. Scale bars: 50 μm (A and C).
Figure 7
Figure 7. Diminished Bmal1 expression enhances neurodegeneration.
(A and B). Bmal1 knockdown in primary neuronal cultures induces neuronal death. (A) Representative phase-contrast photomicrographs from DIV 7 mouse cortical neuron–enriched cultures 5 days after treatment with LV expressing scrambled shRNA (LV-scr) or BMAL1 shRNA (LV-shBMAL1) and after 24 hours of treatment with vehicle (Con) or H2O2. Original magnification, ×10. (B) Quantification of cell viability as assessed by MTT assay. Data are representative of three independent experiments. (C) siRNA-mediated knockdown of Bmal1 in primary astrocyte cultures does not induce astrocyte activation or suppress Nqo1 or Aldh2 transcription. mRNA levels quantified by qPCR and normalized to 18S rRNA. Data are expressed as fold change from sister cultures transfected with scrambled siRNA. The mean ± SEM of four separate experiments is shown. *P < 0.05 by 1-way ANOVA with Bonferroni’s post test. (D and E) Representative photomicrographs showing area of striatal neurodegeneration (dotted line) in WT (D) and Bmal1 hemizygous (E) mice 3 days after intrastriatal injection of 3-NP. Scale bar: 250 μm. (F) Quantification of 3-NP striatal lesion volume as assessed by cresyl violet staining. *P < 0.05 by 2-way ANOVA with a Bonferroni’s post test, as compared with control condition. het, heterodimer.

Comment in

References

    1. Reppert SM, Weaver DR. Molecular analysis of mammalian circadian rhythms. Annu Rev Physiol. 2001. 63: 647 676 - PubMed
    1. Mohawk JA, Green CB, Takahashi JS. Central and peripheral circadian clocks in mammals. Annu Rev Neurosci. 2012;35:445–462. doi: 10.1146/annurev-neuro-060909-153128. - DOI - PMC - PubMed
    1. Hogenesch JB, Gu YZ, Jain S, Bradfield CA. The basic-helix-loop-helix-PAS orphan MOP3 forms transcriptionally active complexes with circadian and hypoxia factors. Proc Natl Acad Sci U S A. 1998;95(10):5474–5479. doi: 10.1073/pnas.95.10.5474. - DOI - PMC - PubMed
    1. Gekakis N, et al. Role of the CLOCK protein in the mammalian circadian mechanism. Science. 1998;280(5369):1564–1569. doi: 10.1126/science.280.5369.1564. - DOI - PubMed
    1. Yu EA, Weaver DR. Disrupting the circadian clock: gene-specific effects on aging, cancer, and other phenotypes. Aging. 2011;3(5):479–493. - PMC - PubMed

Publication types

MeSH terms