. 2014 Jan;15(1):45-53.
doi: 10.1038/ni.2769. Epub 2013 Nov 24.

Perivascular macrophages mediate neutrophil recruitment during bacterial skin infection

Affiliations

Perivascular macrophages mediate neutrophil recruitment during bacterial skin infection

Arby Abtin et al. Nat Immunol. 2014 Jan.

Abstract

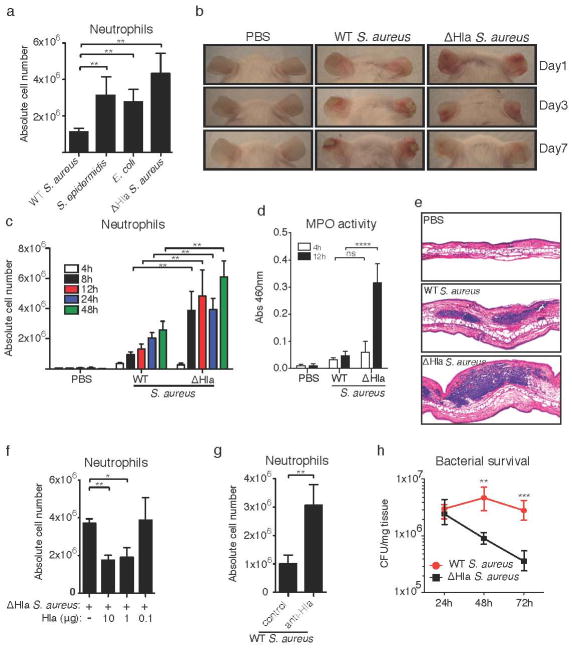
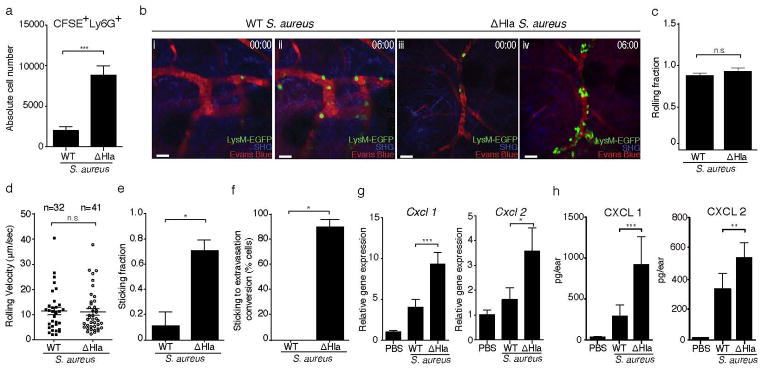
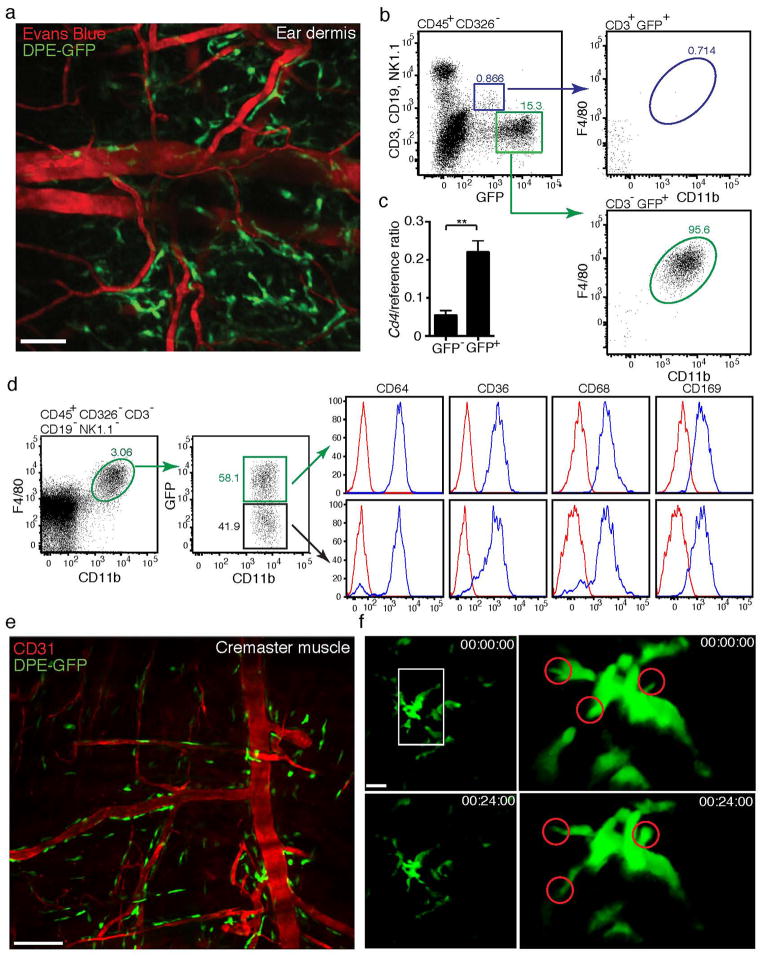
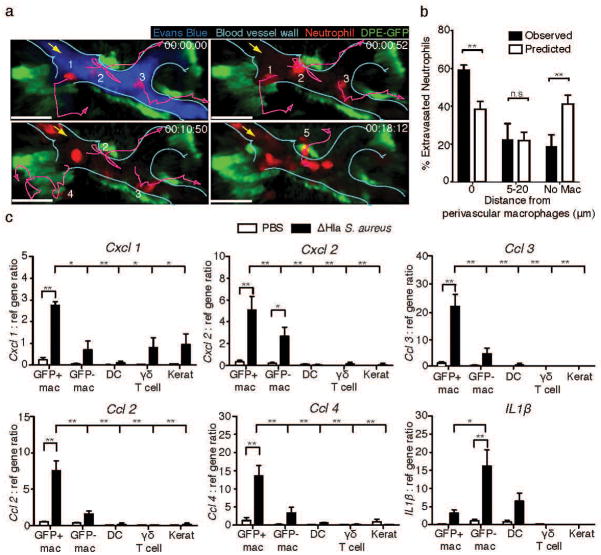
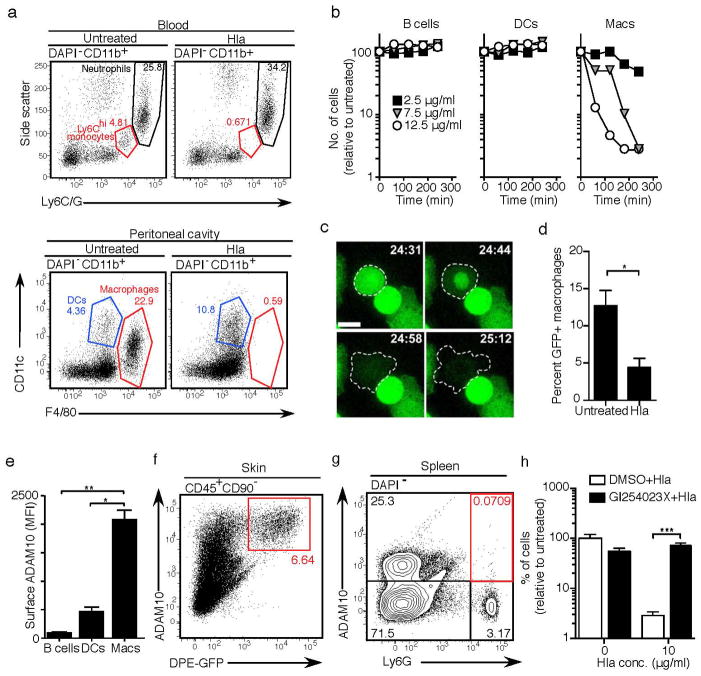
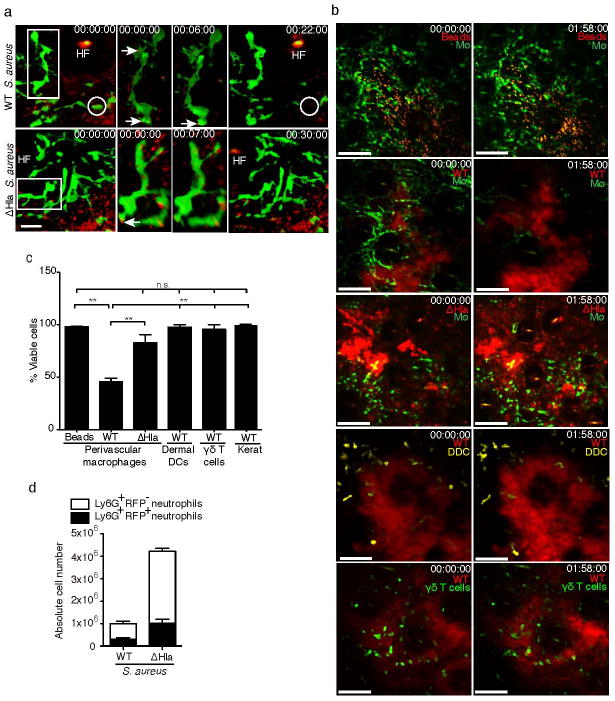
Transendothelial migration of neutrophils in postcapillary venules is a key event in the inflammatory response against pathogens and tissue damage. The precise regulation of this process is incompletely understood. We report that perivascular macrophages are critical for neutrophil migration into skin infected with the pathogen Staphylococcus aureus. Using multiphoton intravital microscopy we showed that neutrophils extravasate from inflamed dermal venules in close proximity to perivascular macrophages, which are a major source of neutrophil chemoattractants. The virulence factor α-hemolysin produced by S. aureus lyses perivascular macrophages, which leads to decreased neutrophil transmigration. Our data illustrate a previously unrecognized role for perivascular macrophages in neutrophil recruitment to inflamed skin and indicate that S. aureus uses hemolysin-dependent killing of these cells as an immune evasion strategy.


Conflict of interest statement

The authors declare no competing financial interests.

Figures

Figure 1
Figure 1. Hla reduces neutrophil influx in S. aureus infected skin resulting in tissue necrosis and increased bacterial survival
(a) Flow cytometry analysis of neutrophil influx in infected ears with indicated bacteria at 12h p.i. n=4 mice/group. (b) Clinical manifestations, and (c) neutrophil influx of ears infected with WT S. aureus, ΔHla S. aureus or after PBS injection at various timepoints mentioned in the figure. n=3 mice/group for PBS injected at each time point and for all groups at 48 hours; n=4 mice/group for WT & ΔHla S. aureus groups at 4h and 8h p.i.; n=5 mice/group for WT & ΔHla at 12h p.i.; n=6 mice/group WT & ΔHla at 24h p.i. (d) Myeloperoxidase activity in ear skin of mice either sham infected (PBS; n=3 mice/group) or infected with WT or ΔHla S. aureus at 4h (n=5 mice/group) and 12h (n=6 mice/group) p.i. A single outlier sample from the 12hr PBS group was excluded from analysis using the ROUT method. (e) Representative haematoxylin and eosin stained ear sections obtained from mice infected with PBS (n=3 mice/group), WT or ΔHla S. aureus at 6h p.i. (n=6 mice/group). (f) Neutrophil influx in ears of mice at 12h p.i. with concomitant injection of ΔHla S. aureus and purified Hla (n=4 mice/group). (g) Neutrophil influx in ears at 12h p.i. with WT S. aureus in mice pretreated with control serum or anti-Hla serum (n=4 mice/group). (h) Bacterial load (CFUs) of infected ears at indicated time points (n=4 mice/group). Bars represent mean±SD. All data are representative of at least 2 independent experiments except for (e), which is from a single experiment. Statistical analysis was performed on log-transformed data as follows: (a and f) one-way ANOVA with Bonferroni’s multiple comparison test; (c, d and h) two-way ANOVA with Bonferroni test; (g) Student’s two-tailed unpaired t-test was used to determine the P-value. **P<0.01; ***P<0.001; ****P<0.0001; n.s, not significant.
Figure 2
Figure 2. Hla-mediated prevention of neutrophil extravasation during cutaneous S. aureus infection
(a) Numbers of CFSE+Ly6G+ neutrophils at 12h p.i., determined by flow cytometry, in WT and ΔHla S. aureus infected ears. CFSE-labeled bone marrow cells were transferred at 10h p.i. Bars represent mean±SD; n=3 mice/group. (b) Intravital multi-photon microscopy showing the increased adhesion and extravasation of adoptively transferred LysM-EGFP+ neutrophils in ΔHla S. aureus (iii,iv) as compared to WT S. aureus (i,ii) infected ear dermis. 00:00, min:sec. SHG, Second harmonic generation. Scale bar, 30μm. Neutrophil rolling fractions (c), mean rolling velocities (d) and sticking fractions (e) in dermal blood vessels of mice infected with WT S. aureus or ΔHla S. aureus. (f) Conversion of neutrophil sticking to extravasation in the blood vessels of mice infected with WT S. aureus or ΔHla S. aureus. n, number of events analyzed per group (cumulative from 3 mice/group). Imaging data shown in (b–f) were from one out of two experiments with n=3 mice/group each. More than 10 vessels of diameters ranging between 1030μm were included in these analyses for each treatment group. Bars represent mean±SEM. (g) Relative Cxcl1 and Cxcl2 mRNA levels as determined by RT-qPCR (PBS: n=3 mice/group; WT and ΔHla S. aureus: n=5 mice/group; mean±SD) and (h) protein levels in mice injected with PBS (n=4) WT S. aureus (n=7) or ΔHla S. aureus (n=8). Bars represent mean±SD. Neutrophil numbers (a) were analyzed using a two-tailed Student’s t-test on log-transformed data. Imaging data were analyzed using either a two-tailed (c and d) or one-tailed (e and f) Mann-Whitney U test. Chemokine data (g and h) were analyzed using a one-way ANOVA and Bonferroni’s post-test following log transformation. *P<0.05; **P<0.01; ***P<0.001. n.s., not significant. Unless otherwise stated data are representative of at least two independent experiments.
Figure 3
Figure 3. Perivascular macrophages can be identified in transgenic DPE-GFP mice
(a) Multi-photon imaging of dermis of DPE-GFP mice showing presence of GFP+ cells with dendritic morphology apposed to dermal vessels (delineated by Evans Blue). Image is representative of more than 3 independent experiments. (b) Flow cytometric analysis of GFP+ cells from ear skin of DPE-GFP mice, showing expression of GFP by CD11bF4/80CD3+ αβ T cells and CD11b+F4/80+ CD3 macrophages (cells were pooled from 3 mice/experiment – representative of two independent experiments). (c) CD4 mRNA expression by sorted GFP+ and GFP CD45+CD11b+F4/80+ macrophages. Bars indicate mean±SEM of 4 independent experiments. Statistical significance was determined using a two-tailed unpaired t-test on log transformed data. (d) Phenotypic analysis of GFP+ and GFP macrophages in DPE-GFP mice (cells pooled from 3 mice/experiment – representative of two independent experiments). (e) Confocal imaging of GFP+ macrophages associated with post-capillary venules in cremaster muscle. (f) Multi-photon imaging of PVM in ear dermis of DPE-GFP mice showing extension and retraction of dendrites. Single cell images have been rotated to better represent dendritic behavior (circled). 00:00:00, hr:min:sec. Imaging data are representative of a minimum of 3 animals (a, e, f) in independent experiments. **P<0.01.
Figure 4
Figure 4. Neutrophils extravasate adjacent to perivascular macrophages in inflamed dermal vessels
(a) Time-lapse intravital multi-photon imaging of ear dermis of DPE-GFP mice infected with ΔHla S. aureus depicting the adherence and extravasation of adoptively transferred neutrophils isolated from mT/mG mice (red, numbered 15) in close proximity to perivascular macrophages (green). Lines (purple) represent migration tracks of selected neutrophils (red) and the arrow (yellow) represents the direction of blood flow in the vessel (cyan). 00:00:00, hr:min:sec. Scale bar 30μm (b) Statistical analysis of neutrophil extravasation site with respect to perivascular macrophages. Numbers of neutrophils extravasating at theoretical/random (white bars) or observed (black bars) distances from GFP+ perivascular macrophages within the same vessels. Data represents 45 total extravasation events from 5 mice pooled from 2 independent experiments. Bars represent mean±SEM. Statistical significance was determined by two-way ANOVA with a Bonferroni’s multiple comparisons test. (c) Relative gene expression by the indicated cell populations (GFP+ or GFP macrophages, dendritic cells (DC), γδ T cells and keratinocytes) isolated from ears of ΔHla S. aureus infected or control (PBS) treated mice at 6h p.i. Data shown are mean±SEM of 3 independent experiments. P-values were calculated using two-way ANOVA with a Bonferroni’s multiple comparison test (between treatment comparisons) and one-way ANOVA with Dunnett’s multiple comparison test (determination of differences between GFP+ macrophages and other cell types from infected animals), *P<0.05; **P<0.01. n.s., not significant.
Figure 5
Figure 5. Hla specifically lyses ADAM10+ macrophages
(a) Leukocytes were isolated from peripheral blood or the peritoneal cavity and incubated with Hla (7.5 μg/ml) for 3h. Cell viability was assessed by flow cytometry. Data are representative of 3 mice from one of two experiments (blood) or more than 10 experiments (peritoneal cells). (b) Specific death of peritoneal macrophages, but not B cells or dendritic cells, in the presence of indicated concentrations of Hla. Symbols represent individual values from a single experiment using cells pooled from 3 mice. Data are representative of more than 10 independent experiments using a range of Hla concentrations and times. (c) In vitro live imaging of peritoneal macrophage cell death in the presence of Hla (7.5 μg/ml). Scale bar 10μm. 00:00, min:sec. Images are representative of two independent experiments using cells isolated from Csf1r-EGFP mice. (d) Death of GFP+ macrophages harvested from the skin of DPE-GFP mice following in vitro culture in the presence of Hla (12.5 μg/ml). Data are expressed as a percentage of total CD45+ cells and are representative of 2 independent experiments (n=4 mice/group). (e) ADAM10 expression levels on peritoneal leukocyte populations as determined by flow cytometry. Data are representative of 2 independent experiments (n=3 mice/group). (f) High level of ADAM10 expression by DPE-GFP+ cells from the skin. Data are from an individual mouse and are representative of 4 independent experiments using cells either from individual animals or pooled from 3 mice. (g) Absence of ADAM10 expression by neutrophils (Ly6G+ cells) in spleen. Data shown are from a single mouse in one of two experiments with a total of n=4 animals. (h) GI254023X mediated protection of peritoneal macrophages from Hla-induced lysis. One out of three experiments using cells pooled from 3 mice performed in quadruplicate is shown. Bars indicate mean±SD of technical replicates. MFI = geometric mean fluorescence intensity. Statistical analysis was performed as follows: (d) two-tailed t-test; (e) one-way ANOVA or (h) two-way ANOVA with Bonferroni’s multiple comparison test on log transformed data. *P<0.05; **P<0.01; ***P<0.0001.
Figure 6
Figure 6. Specific lysis of DPE-GFP+ PVM by ΔHla S. aureus in vivo
(a) Intravital multi-photon images showing phagocytosis of WT and ΔHla S. aureus (red) by DPE-GFP+ macrophages (green). Single cell images have been rotated to highlight bacterial uptake (arrows). A GFP+ macrophage that is lysed during the course of the video is circled. HF, autofluorescent hair follicle. Data are representative of n=2 mice/group from one of two independent experiments. (b) Intravital multi-photon images of ear skin of DPE-GFP mice (macrophage, MΦ) 2h p.i. with RFP-expressing WT S. aureus, ΔHla S. aureus or fluorescent beads. Effects of WT S. aureus infection in ear skin on dermal dendritic cells (CD11c-YFP+) or γδ T cells (CXCR6-GFP+) are also shown. Scale bar, 60 μm. Numbers represent time in hr:min:sec, Pooled data from 2 independent experiments are shown. n=6 for PVM from DPE-GFP mice infected with WT S. aureus and n=3 mice for all other groups. (c) Graph representing quantitative analysis of macrophage, DC, and T cells as shown in (b). Keratinocyte death (Kerat) was analyzed in mT/mG mice using WT S. aureus. Bars represent mean±SEM. Statistical analysis was performed using one-way ANOVA and Bonferroni’s multiple comparison test. (d) absolute numbers of neutrophils with phagocytosed RFP-expressing WT or ΔHla S. aureus in the skin 12h p.i. Data show mean±SD of 3 mice/group and are representative of two independent experiments. Error bars indicate SD. **P<0.01; n.s., not significant.

Comment in

References

    1. Kolaczkowska E, Kubes P. Neutrophil recruitment and function in health and inflammation. Nat Rev Immunol. 2013;13:159–175. - PubMed
    1. Rigby KM, DeLeo FR. Neutrophils in innate host defense against Staphylococcus aureus infections. Semin Immunopathol. 2012;34:237–259. - PMC - PubMed
    1. Nourshargh S, Hordijk PL, Sixt M. Breaching multiple barriers: leukocyte motility through venular walls and the interstitium. Nat Rev Mol Cell Biol. 2010;11:366–378. - PubMed
    1. Kansas G. Selectins and their ligands: current concepts and controversies. Blood. 1996;88:3259–3287. - PubMed
    1. Laudanna C, Kim JY, Constantin G, Butcher E. Rapid leukocyte integrin activation by chemokines. Immunol Rev. 2002;186:37–46. - PubMed

Publication types

MeSH terms