. 2013 Dec 12;504(7479):291-5.
doi: 10.1038/nature12748. Epub 2013 Nov 24.

High-content genome-wide RNAi screens identify regulators of parkin upstream of mitophagy

Affiliations

High-content genome-wide RNAi screens identify regulators of parkin upstream of mitophagy

Samuel A Hasson et al. Nature. .

Abstract

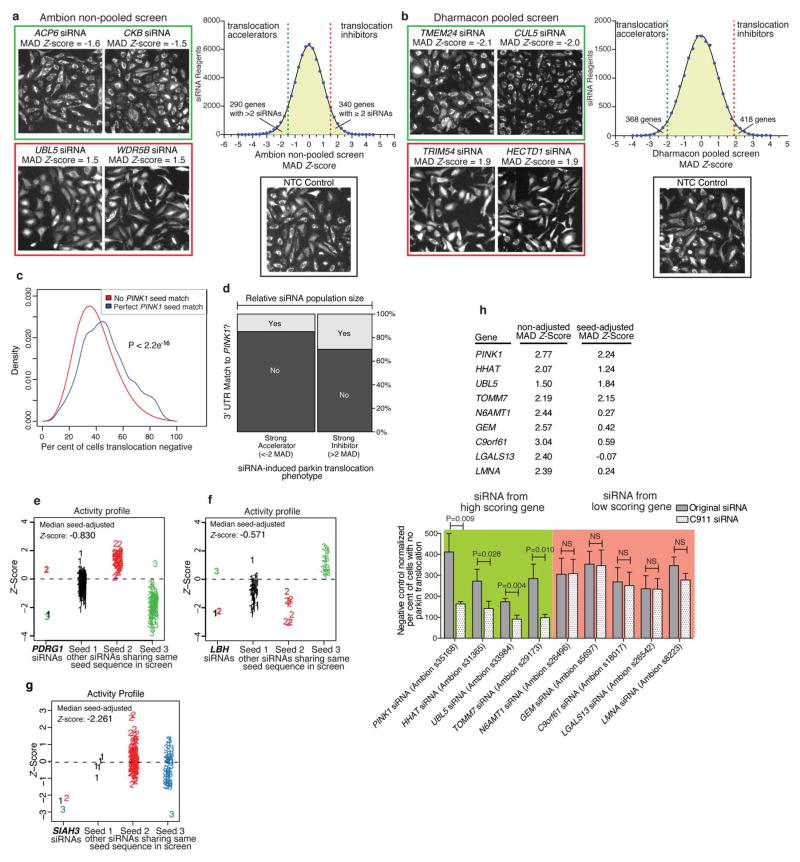
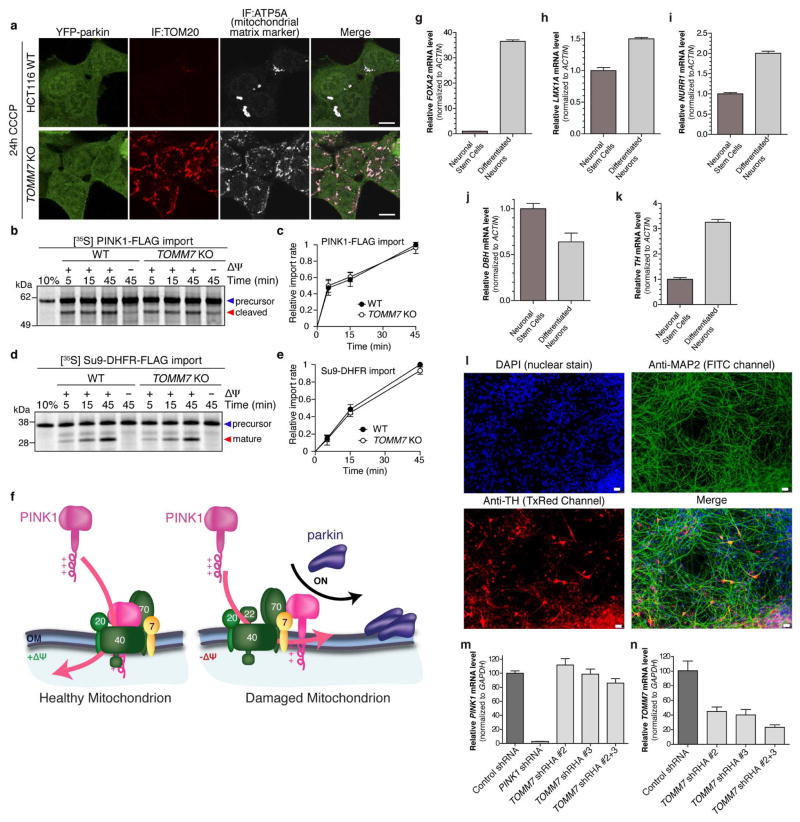
An increasing body of evidence points to mitochondrial dysfunction as a contributor to the molecular pathogenesis of neurodegenerative diseases such as Parkinson's disease. Recent studies of the Parkinson's disease associated genes PINK1 (ref. 2) and parkin (PARK2, ref. 3) indicate that they may act in a quality control pathway preventing the accumulation of dysfunctional mitochondria. Here we elucidate regulators that have an impact on parkin translocation to damaged mitochondria with genome-wide small interfering RNA (siRNA) screens coupled to high-content microscopy. Screening yielded gene candidates involved in diverse cellular processes that were subsequently validated in low-throughput assays. This led to characterization of TOMM7 as essential for stabilizing PINK1 on the outer mitochondrial membrane following mitochondrial damage. We also discovered that HSPA1L (HSP70 family member) and BAG4 have mutually opposing roles in the regulation of parkin translocation. The screens revealed that SIAH3, found to localize to mitochondria, inhibits PINK1 accumulation after mitochondrial insult, reducing parkin translocation. Overall, our screens provide a rich resource to understand mitochondrial quality control.


Conflict of interest statement

The authors declare no competing financial interests.

Figures

Extended Data Figure 1
Extended Data Figure 1. Automated screening strategy and image analysis for the parkin translocation assay
a, GFP–parkin expression in the HeLa screening cell line. Ubiquitinated GFP–parkin (*) indicates parkin activation in the presence of CCCP. b, The screening workflow used ‘assay-ready’ 384-well plates pre-printed with 0.8pmol of library siRNAs. Non-targeting siRNAs (green wells) and PINK1 siRNAs (red wells) were in columns 23 and 24. Cells were reverse transfected with siRNAs 48 h before the parkin translocation assay (addition of 10 μM CCCP). Parallel plate scheduling ensured that the timing of each step in the protocol was consistent across all plates and minimized total length of the screening run. An 8-head peristaltic and 16-head syringe-pump microplate dispensers dispensed reagents during the assay and BioTek EL406 192-tube microplate washer/dispensers were used to remove media and wash. Screening was performing in an environmentally controlled robotic enclosure. High-content microscopy images encompassed the entire cell population of each well. RT, room temperature. All imaged wells were processed with two algorithms from the Molecular Devices MetaXpress PowerCore Server Suite. c, Assessment of parkin translocation exploited the loss of GFP–parkin signal in the nuclear region (in the z-plane) that occurred as parkin accumulated on mitochondria. Utilization of nuclear-to-cytosol correlation yielded a more robust measure of parkin translocation than measuring GFP–parkin co-localization with mito-dsRed since the latter technique was highly affected by cellular morphology. The automated image analysis algorithm first segmented each cell’s nuclear regions by performing top hat and h-dome feature recognition on the Hoechst 33342 staining (DAPI channel image) intensity. Nuclear segmentation created defined ‘windows’ to observe the level of GFP–parkin. These windows were extended by a 3 pixel gap to correct for imperfect channel overlay. Each cell in the image (n, n + 1, and so on) was then interrogated for pixel intensity overlap of the GFP signal (FITC channel image) in the window using a Pearson’s correlation that also sampled pixel intensity in a ring (one-third the width of the nuclear window) that extended into the surrounding cytosol (as a signal reference). After calculating the Pearson’s correlation of the FITC and DAPI image on the total region comprised of the nuclear window, gap and extended ring, cells scoring over a correlation threshold were scored as positive for parkin translocation inhibition. Well-level translocation data was reported as the percentage of cells in the well over the correlation threshold (exhibiting a lack of parkin translocation). d, Cell count and assessment of the mitochondrial signal from the cells in each well was accomplished with the same morphological filters as in c. Cell count was determined through the number of segmented nuclei in the DAPI channel image. Using the nuclear segmentation, the algorithm identified the mitochondrial mass associated with each nucleus in the TxRed channel image. The mito-dsRed signal was then integrated across the segmented mitochondrial region for each cell (n, n + 1, etc.). Well-level mitochondrial signal was reported as the mean of the cell population’s values. See Supplementary Methods for complete details.
Extended Data Figure 2
Extended Data Figure 2. Segmentation examples and screen reproducibility
a, Example segmentation of nuclei (solid red or green spots overlaid on DAPI channel images in top panels) along with the scoring of GFP–parkin translocation (FITC channel image). For parkin translocation overlays in middle panels, translocation negative cells are delimited in green; translocation positive cells in red. Segmentation of mitochondrial mass associated with each segmented nuclei is delimited by magenta overlay in bottom panels. b, Zoomed-out well images, blue box defines regions in a. Translocation overlay is shown for both the DAPI and FITC channels with mitochondrial segmentation shown for the TxRed channel. c, The average and standard deviation of the control siRNAs (PINK1 and NTC) on each plate were used to calculate Z′ scores across the Dharmacon pooled siRNA screen. d, Same as in c, but for the Ambion non-pooled siRNA screen. e, Randomly selected library plates from the pooled and non-pooled siRNA libraries were used to make duplicate assay plates and were run and imaged using the conditions of the original screens. After image analysis and quantification, raw parkin translocation data was plotted from the replicates and correlation was assessed for the non-pooled Ambion (right) and pooled Dharmacon (left) siRNAs. f, Additionally, triplicate copies of a Qiagen follow-up 384-well plate containing siRNAs sets for target reconfirmation were run in the automated parkin translocation assay. Translocation scores from each plate were normalized to a percentage of the mean NTC negative control score and plotted relative to one another. These experiments demonstrated a high degree of technical reproducibility for the parkin translocation assay present in both raw and normalized data. g, To understand the rate of parkin translocation in the automated assay, a time course format in a similar manner as described for the primary screen was assessed (see Supplementary Methods). Automated plate and liquid handling was performed on the Agilent robotic platform to execute the translocation assay (CCCP dispense, incubation, plate fixing). Successive plates were automatically fixed at intervals of 15 min, nuclear stained and imaged on the high-content microscope (as in the original screens). After automated image analysis, data from 45 wells (per siRNA treatment) per plate were plotted as mean ± s.d. from each time point. Data points from PINK1 siRNA wells (squares) and data points from NTC siRNA wells (circles) are plotted. Parkin translocation rates presented are specific to large-scale automated screening in 384-well plates. Owing to differences in cell types, culture environment, temperatures and liquid handling factors, parkin translocation rates differed in low-throughput experiments and were therefore calibrated on an experiment-specific basis. h, The mean ± s.d. of control reagents from each screen was plotted to illustrate the signal window for parkin translocation assessment (pooled screen: NTC n = 1,056, PINK1 n = 1056; non-pooled screen: NTC n = 2,976, and PINK1 n = 2,976). Accel, accelerators of parkin translocation.
Extended Data Figure 3
Extended Data Figure 3. Overview of data analysis workflow
Raw numerical data from high-content data generated in pooled and non-pooled screens was first normalized to the same plate controls before being stored as screen-specific data sets. Aggregate data sets underwent MAD conversion and parkin translocation data was log transformed to achieve near-normal distributions between inhibitors and accelerators. Specific siRNA-level data points were excluded if they failed to pass cell count and mitochondrial intensity filters. Data frequency distributions of cell count (red dots) fit to Gaussian curve (black line) and mitochondrial signal (blue dots) fit to a Gaussian curve (black line) from each screen are presented. Finally, gene candidates that had been withdrawn or were absent from the human genome annotation were removed from respective candidate lists. After candidate lists had been generated based on defined thresholds, a fraction of the genes were selected for follow-up analysis using a diverse set of categories to maximize selection diversity. For the non-pooled candidate lists, gene function and GO annotation queries coupled to STRING database searches (category 2) and annotation analysis (category 4) were employed to select the most promising genes for follow-up studies. The most active gene targets from the pooled screen candidate list were also selected for follow-up analysis (category 3). Finally, a category was also developed for subset of genes having excellent seed-adjusted activity screens from common seed analysis of the non-pooled data set (category 1). See the Supplementary Methods for complete details. Green connecting arrows represent data processing or filtering operations. Red connecting lines indicate decisions made for candidate gene follow-up.
Extended Data Figure 4
Extended Data Figure 4. Activity distributions of parkin translocation data and seed sequence bias
a, Graph of negative control (NTC siRNA) normalized, log transformed MAD Z-score frequency distributions of siRNA-level parkin translocation scores from the Ambion non-pooled screen. The parkin translocation cutoffs (PTC) for selecting siRNA reagents are shown with red (inhibitors) and green (accelerators) dashed lines. Representative cells from Ambion siRNA treated wells scoring near the PTC are shown (boxes are green for accelerators and red for inhibitors). Individual siRNAs meeting PTC, cytotoxicity and mitochondrial signal criteria were determined ‘active’. Genes having at least two active Ambion siRNAs were selected as candidates. b, Same as in a except with the Dharmacon pooled screen data and representative images. In this data set that only had a single reagent per gene, Dharmacon siRNAs meeting PTC, cytotoxicity and mitochondrial signal criteria were selected as gene candidates. The seed sequence of a given siRNA can cause unintended modulation of gene expression through off-target, miRNA-like activity. c, Plot demonstrating shift in parkin translocation inhibition profile for siRNAs from the non-pooled screen whose seed sequences have a perfect match (defined in Supplementary Methods) to the 3′ UTR of PINK1. Statistical differences between curves assessed with a Kolmogorov–Smirnov test. d, Relative fractions of the highly active inhibitor (>2 MAD for parkin translocation) and accelerator (<−2 MAD for parkin translocation) siRNAs from the non-pooled screen with at least six bases of complementarity between guide strand bases 2–8 and the PINK1 mRNA 3′ UTR (hexamer). Bar widths reflect the relative numbers of siRNAs falling into each activity population (highly inhibitory or highly accelerating to parkin translocation). Note that this analysis may only account for a small portion of siRNA off-target behaviour that directly modulates PINK1 expression. The miRNA-like off-target effects of siRNAs in the libraries can work indirectly to affect PINK1 expression by modulating transcription, translation and splicing (for example). e–g, Adjusting the activity scores of siRNAs in the context of other siRNAs that share the same seed sequence (across a non-pooled genome-wide screen) can aid in compensating for the many forms of off-target phenomena. We used this seed-activity adjustment strategy to create a composite seed-adjusted Z-score for each gene in our genome-wide screen of non-pooled siRNAs. As an example, PDRG1 (e) and LBH (f) were both identified as highly active modulators of parkin translocation in the normalized data set. As their common seed plots reveal, the active siRNA seed sequences for these genes were biased towards acceleration of parkin translocation in the screen. This resulted in reduced seed-adjusted Z-scores for PDRG1 and LBH, differentiating them from genes with less promiscuous siRNA seed activities such as SIAH3 (g). h, C911 mismatch control siRNAs were assayed in 384-well plates along with their corresponding siRNA reagents (resynthesized) that had been identified as active in the primary non-pooled screen. The C911 reagents were synthesized with the same sequence and modification chemistry as the original siRNAs except that they contained the complement of bases 9, 10 and 11 of the siRNA guide strand sequence. These arrayed siRNA reagents were reverse transfected into the HeLa screening cell line as was done in the primary screen along with NTC and PINK1 control siRNAs in the plates and translocation of parkin was assessed. Negative control normalized translocation scores (percentage of cells with no parkin translocation) were plotted for both the active siRNAs and their C911 counterparts. All of the original active siRNAs reproduced the parkin translocation inhibition displayed in the original screen (grey bars). However, the C911 analogues (white bars) of the siRNAs with minimal difference between their primary screen Z-score and seed-adjusted Z-score (that is, the siRNAs most likely to be on-target, in the green left portion of the graph) displayed a significant reduction (P < 0.05 by two-tailed t-test) in parkin translocation inhibition. In the case of C911 analogues (white bars) of siRNAs with a low seed-corrected Z-score (that is, the siRNAs likely to be off-target, in the pink right portion of the graph), we observed no such reduction in activity, indicating that these siRNAs were acting through ‘miRNA-like’ activity (a primary driver of off-target effects). Plotted bars represent mean ± s.d. of 3 replicates. NS, not significant (P > 0.05).
Extended Data Figure 5
Extended Data Figure 5. Knockdown analysis of candidate reconfirmation siRNA sets with only one active siRNA reagent and of the top-ranked genes from reconfirmation experiments
af, During candidate gene reconfirmation with four Qiagen siRNAs, we observed that some candidates only displayed a single active (inhibitor of parkin translocation) siRNA in the set. To demonstrate that these are unlikely to be real regulators of parkin translocation, six of these candidates were chosen at random and investigated for Qiagen siRNA knockdown by qRT–PCR. The Qiagen siRNA sets for each candidate were arrayed in 384-plates and reverse transfected into the HeLa screening cell line as executed in the primary screen. Then mRNA was isolated from cells and converted to cDNA for qPCR after 48 h of incubation. Plots are the relative mRNA levels for PHB (a), FBXO27 (b), GPAM(c), DAB1 (d), SKP1 (e) and TMEM62 (f) targets by the specified siRNA reagents that were used in the candidate reconfirmation process. Arrows denote the only siRNA reagent that was active in inhibiting parkin translocation in the reconfirmation experiments. gn, To demonstrate that reconfirmed genes correlated to consistent on-target knockdown by siRNA reagents in the primary screen, we resynthesized these corresponding active reagents. After executing reverse transfection into HeLa screening cell line in 384-plates (same manner as primary screen), mRNA was isolated from cells and converted to cDNA for qPCR after 48 h. Plots are the relative mRNA levels for PINK1 (g), UBL5 (h), BAP1 (i), ATG13 (j), NKAP (k), UBE2J2 (l), UBE2L3 (m) and ABLIM3 (n) targets by the specified siRNA reagents that were originally classified as ‘active’ for parkin translocation inhibition in the primary screen (bars are mean ± s.d. of 3 technical replicates).
Extended Data Figure 6
Extended Data Figure 6. TOMM7 knockdown and knockout supporting data
a, Representative images from low-throughput (in chamber slides) analysis of parkin translocation after CCCP treatment. HeLa screening cell line 48 h post-transfection with indicated siRNAs were treated with CCCP (10 μM CCCP, 2 h) and then fixed. b, Quantification of the translocation phenotype in a. c, Graph of qRT–PCR quantification of TOMM7 mRNA levels from cells as in a. d, Quantification of qRT–PCR performed on mRNA transcripts isolated from wild-type (WT) or TOMM7 knockout (KO) HCT116 cell lines using probes specific to the wild-type TOMM7 transcript as described in the Supplementary Methods. e, Western blot from wild-type and TOMM7 KO HCT116 cell lines with indicated antibodies confirming the absence of TOMM7 in the KO line. f, Quantification of PINK1 mRNA by qRT–PCR performed on mRNA transcripts isolated from wild-type or TOMM7 KO HCT116 cells. Bars in b, c, d and f represent mean ± s.d. of 3 independent experiments. mRNA levels for siRNA knockdowns are presented as a percentage of NTC samples. One-way ANOVA test were used (***P < 0.001). g, Representative images of parkin translocation after CCCP treatment (10 μM). Cells were fixed, permeabilized and stained with antibodies against TOM20 (mitochondrial marker) and HA (to verify TOMM7 expression and localization) for immunofluorescence (IF) analysis. All scale bars represent 10 μm.
Extended Data Figure 7
Extended Data Figure 7. TOMM7 modulates PINK1 accumulation in HCT116 cells and iPS-derived neurons
a, Representative images of mitophagy in TOMM7 wild-type or knockout cell lines stably expressing YFP–parkin after 24 h CCCP (10 μM). Cells were fixed, permeabilized and stained with antibodies against TOM20 to detect degradation of outer mitochondrial membrane and ATP5A to detect removal of mitochondrial matrix protein. Scale bars represent 10 μm. b, Representative autoradiograph from PINK1 import reaction into mitochondria isolated from wild-type and TOMM7 KO HCT116 cells. In healthy mitochondria, imported PINK1 protein is cleaved by MPP and PARL into a mature form. However, when membrane potential is dissipated (−ΔΨ) PINK1 precursor cannot be processed. c, Quantification of radiolabelled PINK1 import from b. d, Representative autoradiograph from the canonical matrix-targeted precursor, Su9–DHFR imported into isolated mitochondria as in b. e, Quantification of radiolabelled Su9–DHFR import in d. f, Model of the function of TOMM7 in healthy and damaged mitochondria. g–k, Differentiation of the NSC cells into iPS-derived neurons was validated with qRT–PCR of mRNA isolated from cells before and following the process. g, Gene expression of FOXA2 (critical signal promoting the initial development of dopaminergic neurons) and h, LMX1A (part of a transcriptional loop that acts to promote the development of mature DA neurons). i, Gene expression of NURR1 (also known as NR4A1) a commonly used marker for the early stages of dopaminergic neuron differentiation. j, Gene expression of dopamine beta-hydroxylase (DBH), an enzyme that catalyses the conversion of dopamine to norepinephrine in sympathetic neurons of the adrenal medulla. DBH was used as a negative control in these experiments as it should not increase in NSCs differentiated into a dopaminergic fate. k, Gene expression of tyrosine hydroxylase (TH) as a marker of dopaminergic neuron differentiation. l, Representative field from immunofluorescence imaging of NSCs that had completed the neuronal differentiation process and then been fixed and stained. Microtubule-associated protein 2 (MAP2) is general neuronal marker. White scale bars represent 100 μm. m, PINK1 mRNA levels from iPS-derived neurons that had been infected with lentiviral shRNA constructs. n, TOMM7 mRNA levels from the same set of lentivirus-treated samples was measured to verify the knockdown. All qRT–PCR experiments are plotted as mean ± s.d. of n = 3 technical replicates.
Extended Data Figure 8
Extended Data Figure 8. HSPA1L and BAG4 supporting data
a, Representative screening HeLa cells confirming HSPA1L siRNA knockdown phenotype after 2 h CCCP treatment (10 μM) using NTC siRNA or HSPA1L siRNA. Images display GFP–parkin (green) and mitochondrial dsRed (red). b, Quantification of the parkin translocation defect under the conditions in a. c, qRT–PCR of HSPA1L mRNA transcripts isolated from cells as in a. d, Representative images of parkin translocation in GPRM2 HeLa cells with gene knockdown of BAG4 and rescue (HA–BAG4 cDNA) after 45 min CCCP treatment (10 μM). The BAG4 is siRNA resistant cDNA. e, Quantification of phenotype observed in d. f, Western blots of BAG4 and PINK1 total protein levels from GPRM cells transfected with either NTC or BAG4 siRNAs and treated for 2 h with CCCP. There is a large decrease in the level ofBAG4 protein in the knockdown compared to controls, but PINK1 levels are unchanged. g. Western blot of PINK1 from cells transfected with NTC, PINK1 or HSPA1L siRNA and Ponceau total protein stain for loading control. Cells were treated with CCCP for 2 h to induce PINK1 stabilization and HSPA1L knockdown does not affect PINK1 levels. h, qRT–PCR of mRNA transcripts isolated from wild-type or HSPA1L knockout HEK cell lines using probes specific to the wild-type (WT) or mutated transcript (KO) as described in the Supplementary Methods section. i, Western blotting with the specific HSPA1A antibody revealed that HSPA1Aprotein levels are unaffected in the HSPA1LKOcell line, and Ponceau total protein stain for loading control. j, PINK1 western blots from wild-type and HSPA1L knockout cells lines that have been transfected with either vector control or mCherry–HSPA1L. PINK1 levels are not detectable in the absence of CCCP and are comparable in both the wild-type and knockout after CCCP treatment, regardless of HSPA1L rescue. k, Images relating to Fig. 4a examining YFP–parkin translocation in wild-type and HSPA1L knockout HEK293 cells at 2 h of CCCP treatment. Cells were either transfected with an empty mCherry vector or mCherry–HSPA1L to rescue the knockout phenotype. l, GFP–parkin was immunoprecipitated from the HeLa screening cell line and the indicated bands were excised for mass spectrometry analysis. Observed HSP70 proteins are indicated (see Supplementary Table 9 for peptide data). Bars in b, c, e and h are mean ± s.d. of 3 independent replicates with significance tested by a one-way ANOVA. White arrows indicate cells with complete parkin translocation.
Extended Data Figure 9
Extended Data Figure 9. Parkin and BAG4 binding and HSPA1L and BAG4 knockdown
a, Representative western blot of immunoprecipitation of YFP–parkin or YFP–parkin ΔUBL in HeLa cells. HA–BAG4 is bound to YFP–parkin and binds more strongly to YFP–parkin ΔUBL. b, Representative images of HA immunoprecipitations using either the empty vector or HA–BAG3, HA–BAG4 or HA–BAG5 in HeLa cells. YFP–parkin shows some binding to all three BAG family members, but is bound at the highest level to HA–BAG4. c, Quantitation of qRT–PCR of HSPA1L mRNA transcripts from cells transfected with NTC, BAG4, HSPA1L or BAG4 plus HSPA1L siRNA in HeLa cells. HSPA1L is knocked down to comparable levels in both the signal (HSPA1L alone) and double (BAG4 plus HSPA1L) siRNA experiments. d, Representative images of parkin translocation in the BE(2)-M17 neuroblastoma cell line stably expressing mitochondrial GFP and native (untagged) parkin transfected with the indicated siRNAs, following 4 h CCCP treatment. Parkin localization was detected by immunofluorescence (red). Scale bars represent 10 μm. e, Quantification of d from three independent experiments (>150 cells were counted per condition) and displayed as mean ± s.d. and use of one-way ANOVA tests (*P < 0.05, ** P < 0.01). f, Model of the potential mechanism of BAG4/HSPA1L regulation of parkin. g, Single channel images of wild-type YFP–parkin and YFP–parkin(R275W) translocation with or without the coexpression of mCherry–HSPA1L or HSPA1A corresponding to Fig. 4f in the main text. White arrows indicate cells with complete parkin translocation. All immunoprecipitation experiments were performed in transiently transfected HeLa cells and are shown as representative images of three independent experiments.
Extended Data Figure 10
Extended Data Figure 10. SIAH3 is a negative regulator of parkin translocation
a, Domain structure within the human SIAH family. Domains include non-conserved N-terminal regions (NT), two zinc-finger motifs (ZF1 and ZF2), a nuclear localization sequence (NLS), and the Seven in absentia (SINA) protein superfamily C-terminal substrate binding domain. SIAH3 contains a unique histidine rich (HIS Rich) region. Conserved histidines and cysteines found in the zinc-finger regions are denoted with H and C, respectively. b, Representative images from SIAH3-Myc expression in HeLa cells with and without 3 h CCCP treatment. IF, immunofluorescence, from antibodies towards specified targets (TOM20 or Myc). c, By western blot, SIAH3–Myc is present primarily in the mitochondrial fraction of cell extracts. d, Immunoprecipitation of PINK1–YFP from HeLa cells transiently transfected with both PINK1–YFP and SIAH3–Myc. e, Quantification of parkin translocation after 30 or 60 min of 10 μM CCCP treatment under the conditions in f from 3 independent experiments (>150 cells were counted per condition). Bars represent mean ± s.d. One-way ANOVA was used to determine the significance of comparisons; *P < 0.05 **P < 0.01, ***P < 0.001. Bracketing lines between bars indicate comparison of partial (solid) or complete (dashed) parkin translocation. f, Representative images (GFP–parkin in green and Tom20 immunofluorescence plus mitochondrial dsRed in red) of screening HeLa cells from independent confirmation of gene knockdown (NTC siRNA versus SIAH3 siRNA) and rescue (vector-only versus SIAH3 cDNA overexpression) phenotypes after 30 or 60 min CCCP treatment (10 μM). The SIAH3 is siRNA resistant cDNA. g, BE(2)-M17 cell line stably expressing mitochondrial GFP and native (untagged) parkin transfected with NTC or SIAH3 siRNA. Since BE(2)-M17 cells were expressing a low amount of parkin and they displayed a slower translocation phenotype, parkin translocation was assessed after 4 h of CCCP. h, Quantification of g from three independent experiments (>150 cells were counted per condition). i, qRT–PCR quantification of SIAH3 mRNA knockdown 48 h after indicated siRNAs were transfected into BE(2)-M17 cells. j, Representative western blot of BE(2)- M17 cell lysates from cells transfected with the indicated siRNA or cDNA combination for 48 h and then treated with 10 μM CCCP for 0, 2 or 4 h. In western blots of BE(2)-M17 cell lysates, an indicated non-specific band is present above the indicated PINK1 band (*) when probed with PINK1 antibody. k, Quantification of j represented as COXII normalized signal from PINK1 bands as a percentage relative to the 0 h CCCP PINK1 reference band. l, qRT–PCR quantification of relative PINK1 mRNA levels after 48 h following indicated siRNA transfection into HeLa cells. NS, not significant. Quantifications are displayed as mean ± s.d. of 3 independent experiments, One-way ANOVA were used to determine the significance of comparisons.
Figure 1
Figure 1. A high-content screening assay for regulators of parkin translocation in HeLa cells following mitochondrial damage
a, Representative images of parkin translocation assay. NTC (non-targeting control), PINK1 (inhibited translocation) and LMAN1 (accelerated translocation) siRNA transfected cells from genome-wide screens. Red-boxed panels are magnified views of GFP–parkin. Scale bars, 100 μm. b, Negative control normalized, log transformed MAD Z-scores of all non-pooled reagents; data ordered from most negative to positive. Dashed red (inhibitors, Inhib) or green lines (accelerators, Accel) are screen-specific cutoffs (see Supplementary Methods) for active siRNA reagents. Yellow dots represent genes explored in this manuscript. c, Same as b but for the pooled RNAi screen; yellow dots represent overlap of candidate gene selections between pooled and non-pooled RNAi screens.
Figure 2
Figure 2. Analysis of active siRNAs revealed linked gene clusters and sources of off-target effects
a, GeneGo cellular processes of candidate genes with significant enrichments (P-value cutoff of 0.05) (Supplementary Table 1). b, Candidate genes with ontology (GO) that included ‘ubiquitin’ and interactions by STRING association. Gene nodes are coloured green (positive regulator), red (negative regulator) and contain ‘D’ if they are members of the ‘druggable’ genome. c, Same as b but for the GO term ‘mitochondria’ or matches to the human MitoCarta database. d, Analysis of group specific (top panel) and aggregate (bottom panel) reconfirmation results (percentages are out of 105 tested). e, Top 10 positive regulator genes that passed reconfirmation (≥2 active siRNAs) in order of total active siRNAs and ties settled by seed-adjusted Z-score. Numbers in brackets indicate seed-adjusted Z-scores and red lettering indicates genes whose knockdown blocked PINK1 accumulation (see Supplementary Table 7). Asterisk indicates inclusion of siRNAs passing ‘active’ thresholds only in raw and non-transformed data sets because they exhibited excellent phenotypes upon inspection. Analyses in a–c were performed on original non-pooled candidate list (Supplementary Table 1) and d, e were performed on the candidates chosen for reconfirmation assays (Supplementary Table 6).
Figure 3
Figure 3. Characterization of TOMM7, a positive regulator of parkin translocation
a, Representative images of HCT116 cells stably expressing YFP–parkin (green) after 2 h of CCCP treatment: wild-type (WT), TOMM7 knockout (KO), or TOMM7 KO with stable expression of HA–TOMM7. Mitochondria are indicated by TOM20 immunofluorescence (red). b, Quantification of parkin translocation in a. c, Quantification of mitophagy observed using cells in a (24 h of CCCP) as measured by the loss of TOM20 and ATP5A signal (See Extended Data Fig. 7a). d, Western blot of whole-cell lysates from cells in a or wild-type HCT116 (lacking parkin) treated with CCCP for 0 or 4 h. An asterisk indicates a non-specific band. e, Blue native polyacrylamide gel electrophoresis (PAGE) import reactions (left) and super-shift (right) assay illustrate PINK1 association with the TOM complex. Blue arrow indicates PINK1 association with the TOM complex, red arrow indicates complex shifted by TOM22 antibody. f, Western blot of PINK1 and tyrosine hydroxylase (TH) levels in neuronal stem cells (NSC) and iPS-derived neurons. g, Quantification of PINK1 levels in f, expressed as the percentage of control levels (n = 4, P < 0.001 compared to control shRNA). Cells were infected with TOMM7 shRNA no. 2 (triangles) or both no. 2 and no. 3 (circles). Quantification in b and c represent three independent experiments (>150 cells were counted per condition), are displayed as mean ± s.d. and using one-way ANOVA tests (***P < 0.001). CCCP, 10 μM. Scale bar; 10 μm. For single channel images of a see Extended Data Fig. 6g.
Figure 4
Figure 4. HSPA1L and BAG4 differentially modulate translocation of parkin to damaged mitochondria
a, Representative images of wild-type (WT) and HSPA1L knockout (KO) HEK293 cells after 2 h CCCP with either mCherry vector or mCherry–HSPA1L overexpression showing rescue (YFP–parkin (green), Tom20 (red)). b, Quantification of parkin translocation from a and other rescue attempts. c, YFP–parkin is present in immunopreciptates of HA–BAG4. d, Quantification of the intensity of bands in c (n = 3). e, siRNA knockdown of both BAG4 and HSPA1L abrogates the phenotype of either individual gene knockdown. f, Translocation of parkin patient mutation R275W. g, Quantification of f. Quantification in b, e and g represent three independent experiments (>150 cells were counted per condition), are mean ± s.d.; one-way ANOVA tests (*P < 0.05, **P < 0.01 and ***P < 0.001). Statistical comparisons are displayed for only complete translocation phenotype. CCCP, 10 μM. White arrows indicate cells with complete parkin translocation. Scale bars, 10 μm. For single channel images of a and f see Extended Data Figs 8k and 9g.

References

    1. Schapira AH, Tolosa E. Molecular and clinical prodrome of Parkinson disease: implications for treatment. Nature Rev Neurol. 2010;6:309–317. - PubMed
    1. Valente EM, et al. Hereditary early-onset Parkinson’s disease caused by mutations in PINK1. Science. 2004;304:1158–1160. - PubMed
    1. Kitada T, et al. Mutations in the parkin gene cause autosomal recessive juvenile parkinsonism. Nature. 1998;392:605–608. - PubMed
    1. Vincow ES, et al. The PINK1–Parkin pathway promotes both mitophagy and selective respiratory chain turnover in vivo. Proc Natl Acad Sci USA. 2013;110:6400–6405. - PMC - PubMed
    1. Narendra D, Tanaka A, Suen DF, Youle RJ. Parkin is recruited selectively to impaired mitochondria and promotes their autophagy. J Cell Biol. 2008;183:795–803. - PMC - PubMed

Publication types

MeSH terms

LinkOut - more resources