. 2013 Dec;20(12):1367-76.
doi: 10.1038/nsmb.2703. Epub 2013 Nov 24.

The human cap-binding complex is functionally connected to the nuclear RNA exosome

Affiliations

The human cap-binding complex is functionally connected to the nuclear RNA exosome

Peter Refsing Andersen et al. Nat Struct Mol Biol. 2013 Dec.

Abstract

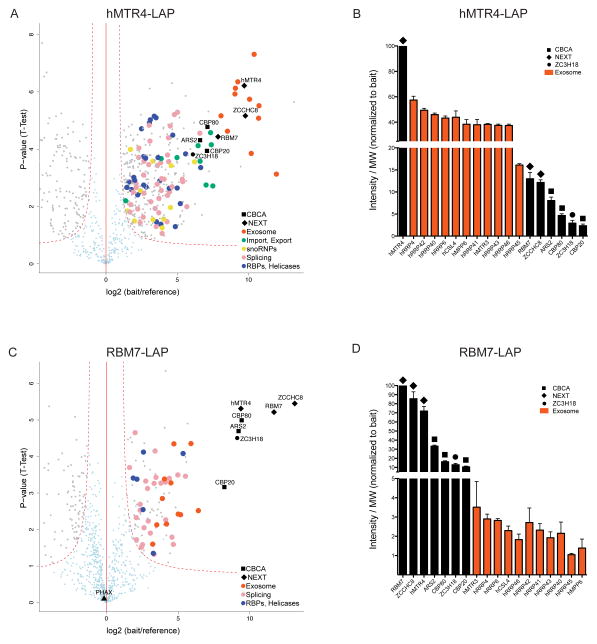
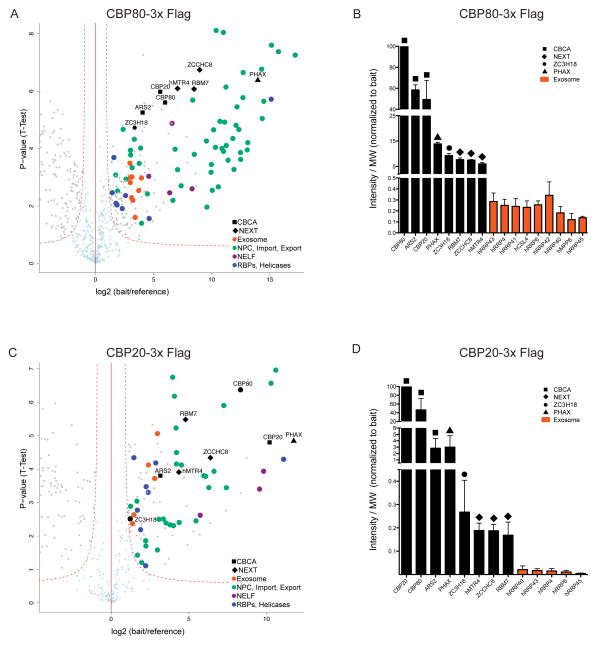
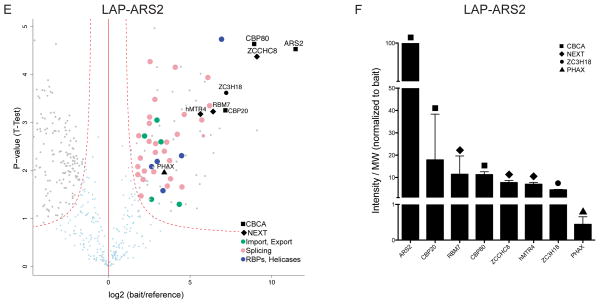
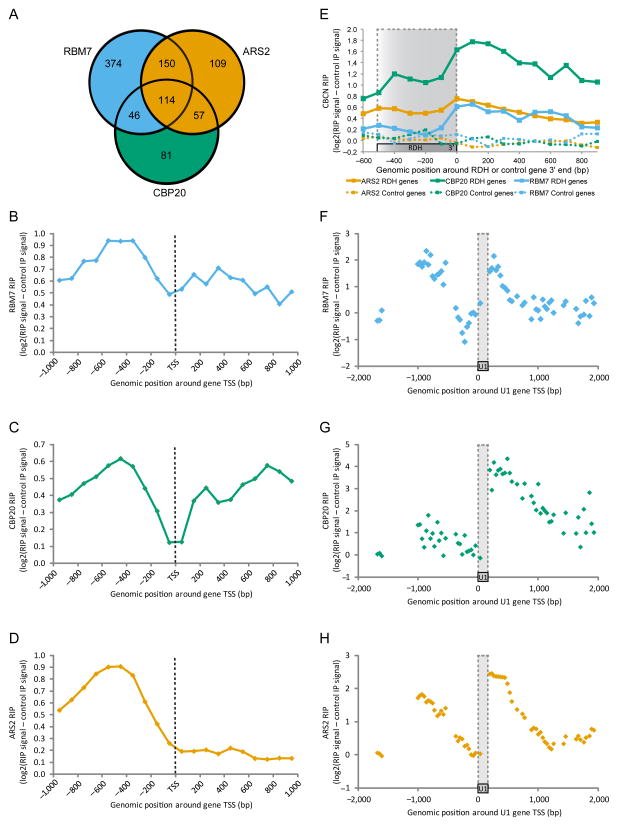
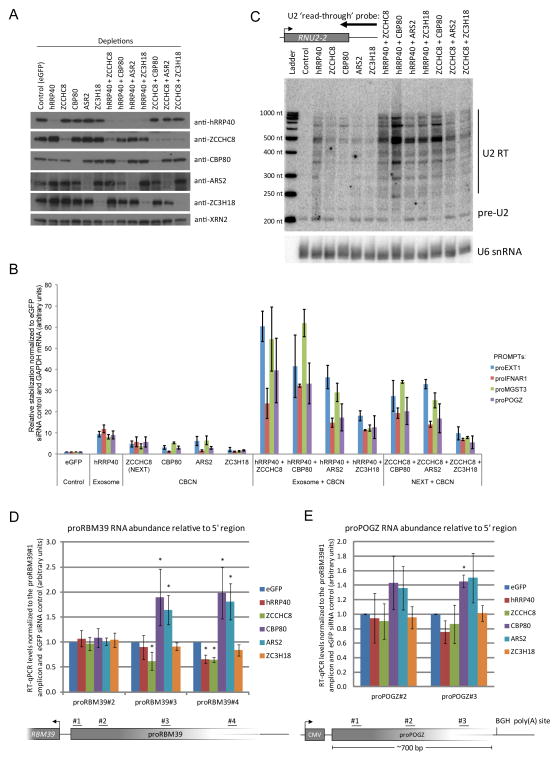
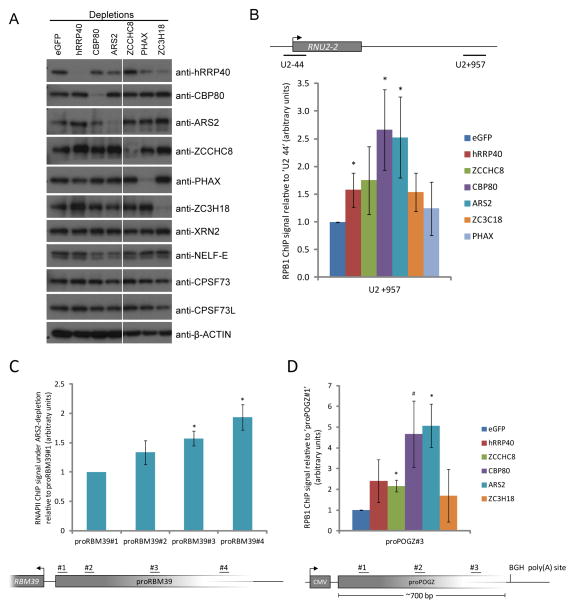
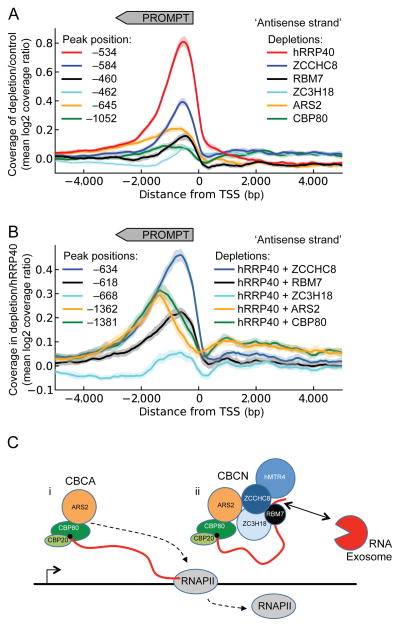
Nuclear processing and quality control of eukaryotic RNA is mediated by the RNA exosome, which is regulated by accessory factors. However, the mechanism of exosome recruitment to its ribonucleoprotein (RNP) targets remains poorly understood. Here we report a physical link between the human exosome and the cap-binding complex (CBC). The CBC associates with the ARS2 protein to form CBC-ARS2 (CBCA) and then further connects, together with the ZC3H18 protein, to the nuclear exosome targeting (NEXT) complex, thus forming CBC-NEXT (CBCN). RNA immunoprecipitation using CBCN factors as well as the analysis of combinatorial depletion of CBCN and exosome components underscore the functional relevance of CBC-exosome bridging at the level of target RNA. Specifically, CBCA suppresses read-through products of several RNA families by promoting their transcriptional termination. We suggest that the RNP 5' cap links transcription termination to exosomal RNA degradation through CBCN.


Figures

Figure 1
Figure 1
AC of NEXT complex components hMTR4 and RBM7 reveal stoichiometrically interacting ZC3H18 and CBCA complex (a) Volcano plot displaying the result of triplicate hMTR4-LAP ACMS experiments. The plot shows log2 ratios of averaged peptide MS intensities (normalized to the protein molecular weight (MW)) between bait and reference (‘bait-less’ cell line) eluate samples (x-axis) plotted against the negative log10 p-values (y-axis) calculated across the triplicate data (t-test). A dashed red hyperbolic curve separates specific hMTR4-interacting proteins (upper right-hand side of plot) marked in gray or color-coded from background (light blue dots) and from enriched proteins from the reference cell line (upper left-hand side of plot). Major hMTR4-interacting protein groups are color-coded as indicated in the legend and protein names relevant for this study are denoted. The full data set of specific co-precipitating proteins is given in Supplementary Table 2. (b) Column chart displaying abundance of selected proteins from hMTR4-LAP AC eluates. Y axis shows peptide intensities divided by protein molecular weight taken from (a) and normalized to results for the bait protein. Note disruption of the axis to reveal intensities of all plotted factors. Error bars represent standard deviation triplicates. (c) Volcano plot displaying the result of triplicate RBM7-LAP ACMS experiments plotted and labeled as in a. The full data set of specific co-precipitants is given in Supplementary Table 3. (d) Column chart displaying abundance of selected proteins from RBM7-LAP AC eluates plotted and labeled as in b.
Figure 2
Figure 2
AC of CBCA complex components CBP80, CBP20 and ARS2 reveals stoichiometric CBCN complex (a,c,e) Volcano plots displaying the results of triplicate CBP80-3xFLAG, CBP20-3xFLAG and LAP-ARS2 ACMS experiments plotted and labeled as in Fig. 1a. The full data sets of specific co-precipitants are given in Tables S4, S5 and S6. (b,d,f) Column charts displaying abundance of selected proteins from CBP80-3xFLAG, CBP20-3xFLAG and LAP-ARS2 AC eluates plotted and labeled as in Fig. 1b.
Figure 2
Figure 2
AC of CBCA complex components CBP80, CBP20 and ARS2 reveals stoichiometric CBCN complex (a,c,e) Volcano plots displaying the results of triplicate CBP80-3xFLAG, CBP20-3xFLAG and LAP-ARS2 ACMS experiments plotted and labeled as in Fig. 1a. The full data sets of specific co-precipitants are given in Tables S4, S5 and S6. (b,d,f) Column charts displaying abundance of selected proteins from CBP80-3xFLAG, CBP20-3xFLAG and LAP-ARS2 AC eluates plotted and labeled as in Fig. 1b.
Figure 3
Figure 3
AC of ZC3H18 identifies stoichiometric CBCN complex (a) Volcano plot displaying the result of triplicate ZC3H18-3xFLAG ACMS experiments plotted and labeled as in Fig. 1a. The full data set of specific co-precipitants is given in Supplementary Table 7. (b) Column chart displaying abundance of selected proteins from ZC3H18-3xFLAG AC eluates plotted and labeled as in Fig. 1b. (c) α-FLAG immunofluorescence microscopy analysis of HEK293 Flp-In T-Rex cells stably expressing ZC3H18-3xFLAG. DAPI stain is included as nuclear marker. Scale bar represents 50 μm.
Figure 4
Figure 4
CBCN components share common RNA targets (a) Venn diagram showing overlap of CBP20, RBM7 and ARS2 RIP signals within promoter upstream regions enriched in each set of duplicate experiments. (b–d) Tiling array signals from RBM7 (b), CBP20 (c) and ARS2 (d) RIP experiments. Regions 1 kb down- and upstream of the TSSs of 430 genes with significant promoter upstream ARS2-RIP signal are displayed. Dotted black lines indicate TSS position. (e) Tiling array signals from RBM7, CBP20 and ARS2 RIP experiments. Mean RIP signal is displayed over regions around the 3′ends of 75 replication-dependent histone genes on chromosome 1 and 6 (solid lines) as well as 100 highly expressed protein coding genes as controls (dotted lines). Areas marked by dotted grey lines roughly indicate RDH gene body position. Note that the plotted RIP signal has been subtracted the signal from the control (no tag) IP, likely explaining the relatively low RIP signal in the RDH gene body region. (f–h) Tiling array signals from RBM7 (e), CBP20 (f) and ARS2 (g) RIP experiments. Regions 2 kb down- and upstream of the four U1 genes on chromosome 1 are displayed. Areas marked by dotted grey lines indicate U1 gene position.
Figure 5
Figure 5
Hyper-accumulation of PROMPTs upon co-depletion of CBCA with NEXT or RNA exosome complex components (a) Western blotting analysis showing protein depletion upon the indicated siRNA administrations. Anti-XRN2 antibody was used as loading control. (b) RT-qPCR analysis of total RNA from HeLa cells subjected to the indicated siRNA transfections and using amplicons for the indicated PROMPT regions (Supplementary Table 10). Data are displayed as mean values normalized to the control (eGFP siRNA) and normalized to GAPDH RNA as an internal control. Error bars represent standard deviations (n=3 biological replicates). (c) Stabilization of 3′-extended U2 RNA upon the indicated single- and co-depletions of CBCA, NEXT and exosome components as assessed by northern blotting analysis. Position of the utilized probe is shown at the top. U6 snRNA was probed as loading control. Detected RNA species and sizes of molecular ladder are displayed to the right and left of the blot, respectively. (d,e) Increased PROMPT ‘read-trough’ RNA levels upon CBP80 and ARS2 depletion. Ratios of proRBM39 (d) and proPOGZ (e) RNA levels relative to their 5′ends (RT-qPCR using amplicons positioned as displayed below the column charts). PROMPT levels relative to those derived from the 5′region are displayed normalized to the eGFP siRNA control. Error bars represent standard deviations (n=3 biological repeats). * P < 0.05 (two tailed one-sample t-test).
Figure 6
Figure 6
CBCA depletion causes inefficient transcription termination and exosome-dependent removal of read-through transcripts (a) Western blotting analysis of whole cell extracts used for ChIP analysis. Display and labeling as in Fig. 5a. (b) Transcriptional read-through of the U2 gene as assessed by monitoring the occupancy by ChIP of the large RNAPII subunit (RPB1) in the U2 read-through (amplicon ‘+957’, top schematics) and the U2 gene promoter (amplicon ‘−44’, top schematics) regions. Amplicon names denote the genomic distance from the respective gene TSS to the nearest end of the amplicon. ChIP analyses were performed with cells previously transfected with control or experimental siRNAs (indicated by color-code; depletion levels shown in a) and results were displayed as the ratio of ‘+957’ to ‘−44’ signals normalized to the eGFP siRNA control.. Error bars represent standard deviations (n=4 biological repeats) * P < 0.05 (two-tailed one-sample t-test). (c,d) CBCA-dependent termination of promoter upstream transcription. RNAPII (RPB1) ChIP analysis on cells containing the proRBM39 (c) and proPOGZ (d) loci from Fig. 5d,e and using the indicated PCR amplicons. Cells were factor-depleted as in a. Displayed results are the signal ratio from a given amplicon relative to the 5′-most amplicon. All signals were normalized to the eGFP siRNA control. Error bars represent standard deviations (n=3 biological repeats). * P < 0.05 and # P < 0.1 (two-tailed one-sample t-test).
Figure 7
Figure 7
CBCA depletion displays a genome-wide termination defect of PROMPT transcription (a) Coverage profiles of mean log2(ratio) between indicated factor depletion (color coded) and control (eGFP siRNA) sample plotted on the antisense strand ± 5 kb relative to the annotated gene TSSs. Peak positions of each curve smoothened over 501-bp sliding windows are noted in the left side of the diagram. The direction of PROMPT transcription is indicated by grey arrow-box on top. Faded areas represent 95% confidence intervals for each curve (bootstrap analysis with 1000 resampling replicates). (b) Coverage profiles plotted and presented as in a, but with indicated co-depletions relative to the hRRP40-depleted sample. Dotted lines indicate peak positions of each curve. (c) Model for assembly and utility of CBCN in human nuclear RNA metabolism. i) The CBCA complex associates with the nascent RNA cap and impacts TSS-proximal transcript termination. ii) CBCN assembles on the RNA-CBC platform of these transcripts and recruits the RNA exosome. See text for details.

Comment in

References

    1. Chlebowski A, Lubas M, Jensen TH, Dziembowski A. RNA decay machines: The exosome. Biochim Biophys Acta. 2013;1829:552–60. - PubMed
    1. Houseley J, Tollervey D. The many pathways of RNA degradation. Cell. 2009;136:763–76. - PubMed
    1. Staals RH, et al. Dis3-like 1: a novel exoribonuclease associated with the human exosome. Embo J. 2010;29:2358–67. - PMC - PubMed
    1. Tomecki R, et al. The human core exosome interacts with differentially localized processive RNases: hDIS3 and hDIS3L. Embo J. 2010;29:2342–57. - PMC - PubMed
    1. Lykke-Andersen S, Brodersen DE, Jensen TH. Origins and activities of the eukaryotic exosome. J Cell Sci. 2009;122:1487–94. - PubMed

Publication types

MeSH terms

Substances

Associated data