. 2013 Dec;15(12):1415-23.
doi: 10.1038/ncb2873. Epub 2013 Nov 24.

Somatic cells regulate maternal mRNA translation and developmental competence of mouse oocytes

Affiliations

Somatic cells regulate maternal mRNA translation and developmental competence of mouse oocytes

Jing Chen et al. Nat Cell Biol. 2013 Dec.

Abstract

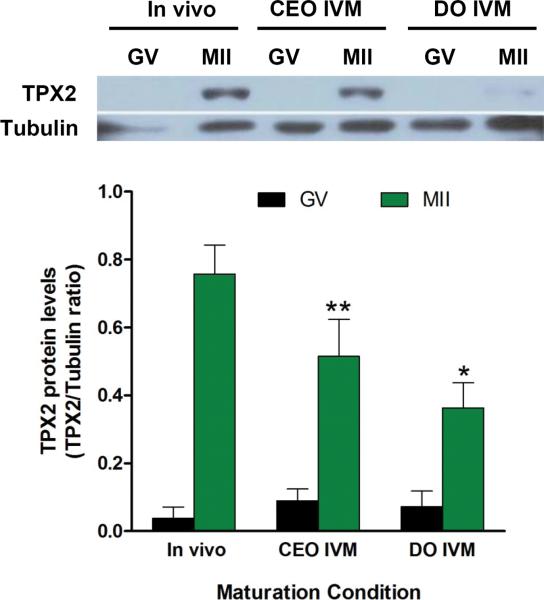
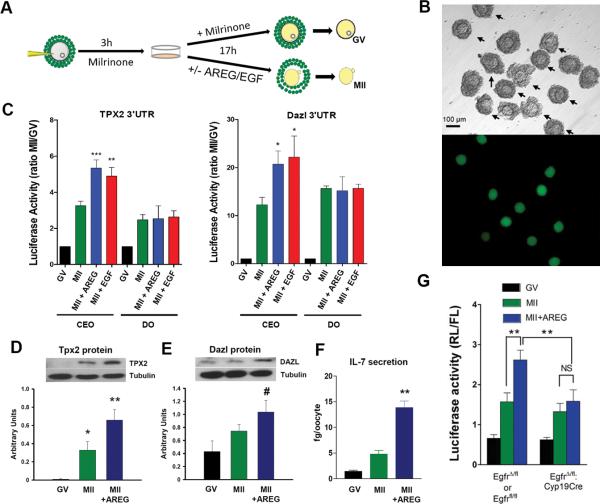
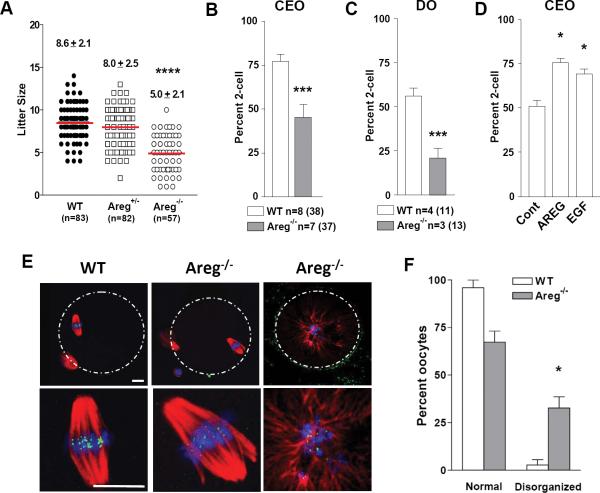
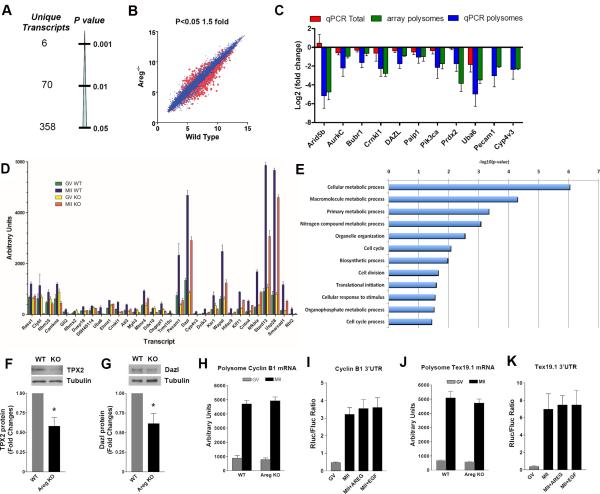
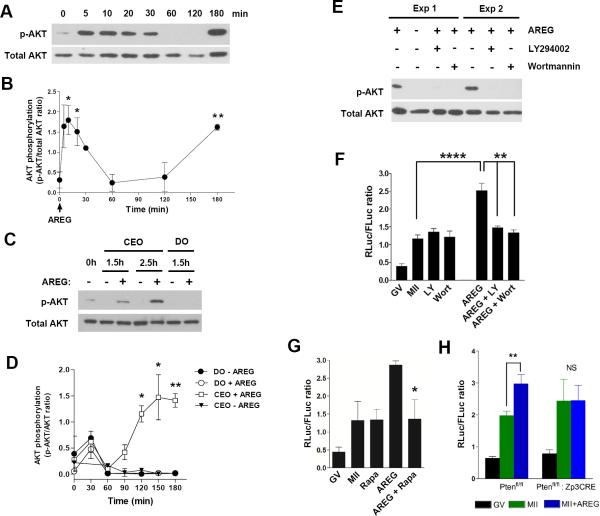
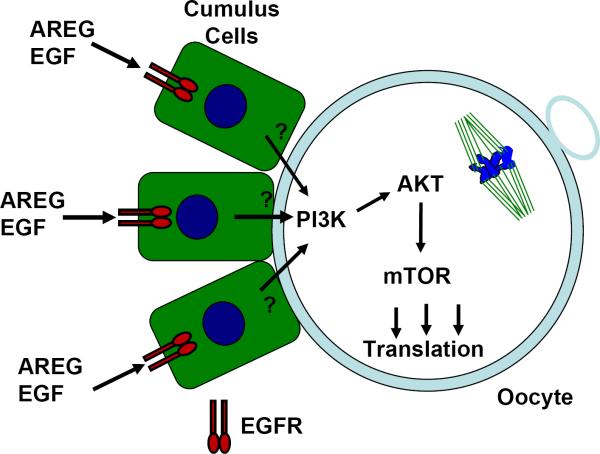
Germ cells divide and differentiate in a unique local microenvironment under the control of somatic cells. Signals released in this niche instruct oocyte reentry into the meiotic cell cycle. Once initiated, the progression through meiosis and the associated programme of maternal messenger RNA translation are thought to be cell autonomous. Here we show that translation of a subset of maternal mRNAs critical for embryo development is under the control of somatic cell inputs. Translation of specific maternal transcripts increases in oocytes cultured in association with somatic cells and is sensitive to EGF-like growth factors that act only on the somatic compartment. In mice deficient in amphiregulin, decreased fecundity and oocyte developmental competence is associated with defective translation of a subset of maternal mRNAs. These somatic cell signals that affect translation require activation of the PI(3)K-AKT-mTOR pathway. Thus, mRNA translation depends on somatic cell cues that are essential to reprogramme the oocyte for embryo development.


Figures

Fig. 1
Fig. 1. The protein levels of the spindle component TPX2 is dependent on the environment in which the oocyte matures
Representative and cumulative data of Western blots of TPX2 protein in GV and MII oocytes matured in vivo, or in vitro matured in complex with cumulus cells (CEO), or when denuded prior to maturation in vitro (DO). Tubulin was used as loading control. The bar graph is the summary of densitometric measurements (mean ± SEM) of Western blots done with four different oocyte extracts prepared on different days. Data are presented as ratio of TPX2/ Tubulin intensity (see Supplementary Table S3 for statistics source data). Paired T test: * p=0.013 MII DO versus MII in vivo.** p=0.0022 CEO MII versus MII in vivo. MII DO versus CEO MII not significant (p= 0.316).
Fig. 2
Fig. 2. EGF-like growth factor stimulation of cumulus/oocyte complexes in vitro increases translation in oocytes
A. Scheme describing the experimental conditions to measure translation rates in cumulus enclosed oocytes (CEO). Oocytes still in complex with cumulus cells were injected with two reporters, one coding for the renilla luciferase under the control of maternal mRNA (Tpx2 or Dazl) 3’UTR and one coding for the firefly luciferase with polyadenylated 3’ UTR. After three hours of incubation in the presence of milrinone to maintain the meiotic arrest, a group of injected CEO was washed free of inhibitor and incubated with or without EGF-like growth factors. In some experiments, an additional group of CEOs was mechanically denuded and oocytes incubated with growth factors as above. At the end of the incubation, oocytes were dissected free of cumulus cells and luciferase activity was measured in oocyte extracts. B. Expression of GFP in CEOs after microinjection documenting the accuracy of the injection and confinement of the fluorescence to the oocyte. C. Ratio of renilla/firefly luciferase activity in oocytes cultured as CEO or denuded incubated with or without AREG (100nM) or EGF (10nM). Each bar is the ratio of MII/GV activities and mean ± SEM of 6 experiments for TPX2 and 4 experiments for Dazl. T test: * p<0.05; ** p<0.01; *** p<0.001 vs MII. D,E. CEO were incubated as in C and at the end of the incubation, oocytes were denuded, and extracts were used to evaluate endogenous Dazl and TPX2 protein levels by Western Blot. Tubulin was used as loading control. The bar graph is the summary of densitometric measurements (mean ± SEM) of 5 Western blots for TPX2 and 6 for Dazl done with different oocyte extracts. T test: * p<0.05 vs GV; ** p<0.01 vs MII; # p<0.05 vs MII. F. Bars represent the mean ± SEM of 4 experiments where IL-7 accumulation was measured in spent media of CEO cultured as in C with or without AREG. T test: ** p<0.01 vs MII. G CEO were prepared from PMSG-treated Egfrflfl , EgfrΔ/fl, or EgfrΔ/fl:Cyp19 CRE mice. They were then injected with a Tpx2 luciferase reporter and incubated as detailed in panel A in the absence or presence of AREG. At the end of the incubation, oocytes were dissected free of cumulus cells and luciferase activity was measured in oocyte extracts. The data from Egfrflfl and EgfrΔ/fl groups gave similar results and were combined. Data are the mean ± SEM of 4 independent experiments. Paired T test: * p=0.018 MII+AREG vs MII of Egfrflfl /EgfrΔ/fl ; NS = 0.78 MII+AREG vs MII of EgfrΔ/fl:Cyp19 CRE; p=0.033 MII+ AREG of Egfrflfl vs MII+AREG of EgfrΔ/fl:Cyp19 CRE. See Supplementary Table S3 for statistics source data
Fig. 3
Fig. 3. Compromised developmental competence of oocytes from Areg−/−mice
A. Summary of offspring from mating of wild type, Areg +/−, and Areg−/− mice. The number of litters is reported below the scatterplot. T test: **** p<0.0001 vs. WT. B. Bars represent the mean ± SEM of the two cell-embryo yield after in vitro fertilization (IVF) using CEOs from super-ovulated wild type and Areg−/− mice. T test: *** p<0.0001 vs. WT. The number of IVF experiments performed is reported below the bars. The number in parenthesis indicates the number mice used. C. After superovulation, a group of MII CEOs was stripped of cumulus cells and used for IVF. Bars represent the mean ± SEM of two cell-embryo yield. T test: *** p<0.001 vs. WT. The number of IVF experiment performed is reported below the bars. D. Bars represent the mean ± SEM of two cell embryo yield of wild type CEOs harvested from PMSG treated mice, cultured in vitro in the absence or presence of AREG for 12 hr until they had reached the MII stage and then used for IVF. T test:* p<0.05 vs. WT. E. Representative spindles from wild type and MII Areg−/− oocytes derived from superovulated CEO. Bar corresponds to 10 μm. F. Incidence of aberrant spindle formation n WT and Areg−/− oocytes; Bars represent the mean ± SEM of 3 experiments. paired T test: * p<0.05 vs. WT. See Supplementary Table S3 for statistics source data.
Fig. 4
Fig. 4. Altered mRNA translation of a subgroup of maternal mRNAs in Areg−/−
oocytes. A,B. Analysis of polysome-associated transcripts in wild type and Areg−/− MII oocytes. Three distinct pools of 500-750 oocytes from wild type and Areg−/− mice were used for the analysis. The actual data are reported in Supplemental Tables1 and 2. C. Comparison of hybridization data and qPCR of total and polysome-bound distribution of selected transcripts; T test p <0.05 from three distinct mRNA preparations. D. Comparison of recruitment to the polysome of most downregulated transcripts in Areg-/-oocytes. The ratio MII/GV was calculated for the top 31 transcripts whose levels were most significantly different in polysomes from MII Areg−/− oocytes compared to WT MII. Data are reported as Mean ± SE intensity for three biological replicates. Actual data and statistics are reported in Table 1 and 2. Of note, many of the transcripts downregulated in the Areg−/− are recruited to the polysome during the GV-to-MII transition. E. Gene Ontology analysis of transcripts significantly different in WT and Areg−/− oocytes. Transcripts recovered at levels significantly different in the polysomes (p<0.05) and with WT/Areg−/− ratio of at least 1.5 were included in the analysis. Enriched Gene Ontology terms were discovered using DAVID (see methods for details). F,G. comparison of TPX2 and Dazl levels in wild type and Areg-/- super-ovulated MII oocytes. The bars are the mean ± SEM of densitometric analysis of 5 Western blots for TPX2 and 4 Western blots for Dazl proteins don on different groups of oocytes. T test: * p<0.05 vs. WT. H. Bars represent the mean ± SEM of polysome associated Cyclin B1 mRNA in wild type and Areg−/− oocytes. G. In vitro translation of cyclin B1 3’ UTR reporter in CEO cultured with or without AREG. Bars represent the mean ± SEM of 3 distinct experiments with different pools of CEOs. J. Bars represent the mean ± SEM of polysome associated Tex19.1 mRNA in wild type and Areg−/− oocytes. K. In vitro translation of the Tex19.1 3’ UTR reporter in CEO cultured with or without AREG. Bars are the mean ± SEM of 3 separate experiments. In experiments reported in panel H-K, no statistical difference could be observed between the WT and Areg−/− groups. See Supplementary Table S3 for statistics source data.
Fig. 5
Fig. 5. PI3K/AKT/mTOR signaling is involved in the somatic regulation of oocyte mRNA translation
A. Representative Western blot of the time course of AKT Ser473 phosphorylation in CEOs incubated with AREG for different times. Extracts from total CEOs were used for the Western blot. B. Densitometric analysis of AKT Ser473 phosphorylation at different times after AREG exposure. Total CEO extracts were used for these measurements. Each point is the mean ± SEM of 3 different experiments. * T test: p<0.05 and ** p<0.01 vs zero time point. C. Representative Western blot of AKT Ser473 phosphorylation measured in oocyte extracts after stimulation when still in complex with cumulus cells (CEOs) or after denudation (DO). D. Densitometric analysis of AKT Ser473 phosphorylation measured in oocytes incubated with or without AREG when still in complex with cumulus cells (CEO) or after denudation. Each point is the mean ± SEM of 3 different experiments. T test: * p<0.05 and ** p<0.01 vs DO groups. Of note, phosphorylation of AKT at 0 and 30 min was highly variable. Although not significant, this trend to an increase in S473 phosphorylation at 30 min is likely due to mechanical stress due to manipulation of the oocytes during denudation. This increase is observed whether oocytes are derived from CEO or are incubated as denuded oocytes in the absence or presence of AREG. E,F. The AREG dependent activation of translation of the TPX2 reporter is prevented by PI3K inhibitors (LY294002 and Wortmannin) which block AKT phosphorylation in the oocyte. After microinjection of the TPX2 reporter, CEO were preincubated with inhibitors for 30 min and then incubated with or without AREG for 2 additional hrs. At the end of the incubation, oocytes were freed of cumulus cells and used for Western blot analysis (E). For luciferase assays (F), CEOs were incubated overnight. All oocytes used in the luciferase assays had reached the MII stage as indicated by the presence of polar body. Data are the mean ± SEM of 4 independent experiments. T test: **** p<0.0001 and ** p<0.01 . G. Effect of the mTOR inhibitor rapamycin on the AREG-dependent increase in TPX2 reporter translation. Data are the mean ± SEM of 4 independent experiments. T test:* p<0.05 vs. AREG. H. Intact PI3K signaling in the oocyte is necessary for the AREG-dependent increase in Tpx2 reporter translation. CEOs were derived from Ptenfl/fl: Zp3-CRE mice, where Pten gene is deleted only in the oocytes, and Ptenfl/fl littermates which behave as wild type mice. The incubation and the luciferase assay were conducted as detailed in Fig 2. Each point is the mean ± SEM of 3 experiments conducted in different days. T test: ** p=0.009 Ptenfl/fl MII+AREG vs MII; NS (not significant) Ptenfl/fl: Zp3-CRE MII+AREG vs MII. See Supplementary Table S3 for statistics source data.
Fig. 6
Fig. 6. Model of the signaling pathways involved in somatic cell control of oocyte translation
Cumulus cells are represented as green squares with a blue nucleus. An MII oocyte is schematically represented with a spindle and a polar body. EGFR dimers are represented by green/red symbols. EGF-like growth factors released from mural granulosa cells interact with EGFRs expressed on cumulus cells and cause activation on undefined signaling pathway/s across the cumulus/oocyte plasma membrane. These signals lead to PI3K activation in the oocyte. The resulting phosphorylation of AKT and mTOR activation in oocytes leads to an increase in translation of a subset of maternal mRNAs.

Comment in

  • Somatic guidance for the oocyte.
    Gilchrist RB, Richani D. Gilchrist RB, et al. Dev Cell. 2013 Dec 23;27(6):603-5. doi: 10.1016/j.devcel.2013.12.006. Dev Cell. 2013. PMID: 24369833

References

    1. Spradling A, Fuller MT, Braun RE, Yoshida S. Germline stem cells. Cold Spring Harb Perspect Biol. 2011;3:a002642. - PMC - PubMed
    1. Yoshida S. Spermatogenic stem cell system in the mouse testis. Cold Spring Harb Symp Quant Biol. 2008;73:25–32. - PubMed
    1. Matzuk MM, Burns KH, Viveiros MM, Eppig JJ. Intercellular communication in the mammalian ovary: oocytes carry the conversation. Science. 2002;296:2178–2180. - PubMed
    1. Gosden R, Lee B. Portrait of an oocyte: our obscure origin. J Clin Invest. 2010;120:973–983. - PMC - PubMed
    1. Chian RC, Lim JH, Tan SL. State of the art in in-vitro oocyte maturation. Curr Opin Obstet Gynecol. 2004;16:211–219. - PubMed

Publication types

MeSH terms