Optimizing 18F-FDG PET/CT imaging of vessel wall inflammation: the impact of 18F-FDG circulation time, injected dose, uptake parameters, and fasting blood glucose levels
- PMID: 24271038
- PMCID: PMC4024166
- DOI: 10.1007/s00259-013-2569-6
Optimizing 18F-FDG PET/CT imaging of vessel wall inflammation: the impact of 18F-FDG circulation time, injected dose, uptake parameters, and fasting blood glucose levels
Abstract
Purpose: (18)F-FDG PET is increasingly used for imaging of vessel wall inflammation. However, limited data are available on the impact of methodological variables, i.e. prescan fasting glucose, FDG circulation time and injected FDG dose, and of different FDG uptake parameters, in vascular FDG PET imaging.
Methods: Included in the study were 195 patients who underwent vascular FDG PET/CT of the aorta and the carotids. Arterial standardized uptake values (meanSUVmax), target-to-background ratios (meanTBRmax) and FDG blood-pool activity in the superior vena cava (SVC) and the jugular veins (JV) were quantified. Vascular FDG uptake values classified according to the tertiles of prescan fasting glucose levels, the FDG circulation time, and the injected FDG dose were compared using ANOVA. Multivariate regression analyses were performed to identify the potential impact of all variables described on the arterial and blood-pool FDG uptake.
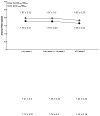
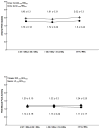
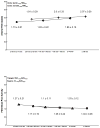
Results: Tertile analyses revealed FDG circulation times of about 2.5 h and prescan glucose levels of less than 7.0 mmol/l, showing a favorable relationship between arterial and blood-pool FDG uptake. FDG circulation times showed negative associations with aortic meanSUVmax values as well as SVC and JV FDG blood-pool activity, but positive correlations with aortic and carotid meanTBRmax values. Prescan glucose levels were negatively associated with aortic and carotid meanTBRmax and carotid meanSUVmax values, but were positively correlated with SVC blood-pool uptake. The injected FDG dose failed to show any significant association with vascular FDG uptake.
Conclusion: FDG circulation times and prescan blood glucose levels significantly affect FDG uptake in the aortic and carotid walls and may bias the results of image interpretation in patients undergoing vascular FDG PET/CT. The injected FDG dose was less critical. Therefore, circulation times of about 2.5 h and prescan glucose levels less than 7.0 mmol/l should be preferred in this setting.
Conflict of interest statement
Conflict of interest statement:
The authors declare that they have no conflict of interest.
Figures


References
-
- Rudd JH, Warburton EA, Fryer TD, Jones HA, Clark JC, Antoun N, et al. Imaging atherosclerotic plaque inflammation with [18F]-fluorodeoxyglucose positron emission tomography. Circulation. 2002;105:2708–11. - PubMed
-
- Elkhawad M, Rudd JHF. Radiotracer imaging of atherosclerotic plaque biology. Cardiol Clin. 2009;27:345–54. - PubMed
-
- Tawakol A, Migrino RQ, Bashian GG, Bedri S, Vermylen D, Cury RC, et al. In vivo 18F-fluorodeoxyglucose positron emission tomography imaging provides a noninvasive measure of carotid plaque inflammation in patients. J Am Coll Cardiol. 2006;48:1818–24. - PubMed
-
- Sheikinea Y, Akramc K. FDG–PET imaging of atherosclerosis: Do we know what we see? Atherosclerosis. 2010;211:371–80. - PubMed
Publication types
MeSH terms
Substances
Grants and funding
LinkOut - more resources
Full Text Sources
Other Literature Sources
Medical

