

An interferometric reflectance imaging sensor for point of care viral diagnostics
- PMID: 24271115
- PMCID: PMC4041624
- DOI: 10.1109/TBME.2013.2272666
An interferometric reflectance imaging sensor for point of care viral diagnostics
Abstract
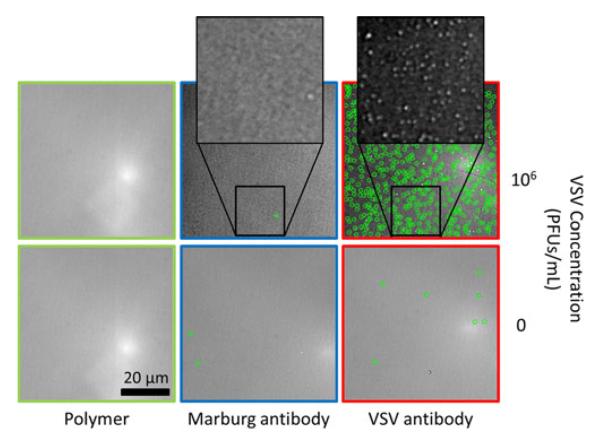
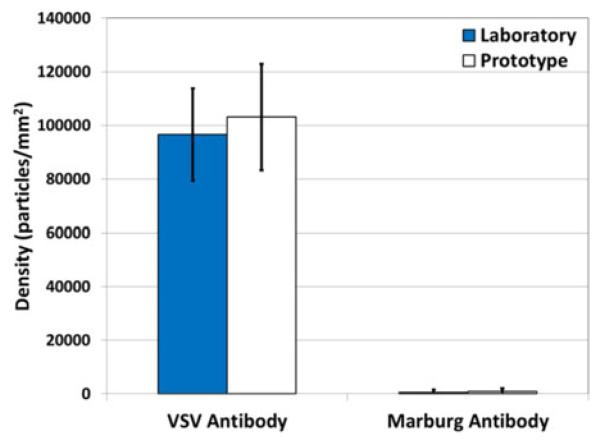
The use of in vitro diagnostic devices is transitioning from the laboratory to the primary care setting to address early disease detection needs. Time critical viral diagnoses are often made without support due to the experimental time required in today's standard tests. Available rapid point of care (POC) viral tests are less reliable, requiring a follow-on confirmatory test before conclusions can be drawn. The development of a reliable POC viral test for the primary care setting would decrease the time for diagnosis leading to a lower chance of transmission and improve recovery. The single particle interferometric reflectance imaging sensor (SP-IRIS) has been shown to be a sensitive and specific-detection platform in serum and whole blood. This paper presents a step towards a POC viral assay through a SP-IRIS prototype with automated data acquisition and analysis and a simple, easy-to-use software interface. Decreasing operation complexity highlights the potential of SP-IRIS as a sensitive and specific POC diagnostic tool. With the integration of a microfluidic cartridge, this automated instrument will allow an untrained user to run a sample-to-answer viral assay in the POC setting.
Figures
References
-
- Rajan A, Glorikian H. Point-of-care diagnostics: Market trends and growth drivers. Expert Opin. Med. Diagnos. 2009;3(1):1–4. - PubMed
-
- Debnath M, Prasad GBKS, Bisen PS. Molecular Diagnostics: Promises and Possibilities. Springer; Dordrecht, The Netherlands: 2010. Segments of molecular diagnostics—Market place; pp. 503–513.
-
- Choi YJ, Nam HS, Park JS, Kim HJ, Park KB, Jeon MH, Kim CJ, Hwangbo Y, Park KS, Baek KA. Comparative analysis of the multiple test methods for the detection of pandemic influenza A/H1N1 2009 Virus. J. Microbiol. Biotechnol. 2010 Oct;20(10):1450–1456. - PubMed
-
- Chartrand C, Leeflang MMG, Minion J, Brewer T, Pai M. Accuracy of rapid influenza diagnostic tests: A meta-analysis. Ann. Internal Med. 2012;156:500–511. - PubMed
-
- Harper SA, Bradley JS, Englund JA, File TM, Gravenstein S, Hayden FG, McGeer AJ, Neuzil KM, Pavia AT, Tapper ML, Uyeki TM, Zimmerman RK. Seasonal influenza in adults and children – diagnosis, treatment, chemoprophylaxis, and institutional out-break management: Clinical practice guidelines of the Infectious Diseases Society of America. Clin. Infect. Dis. 2009 Apr;48(8):1003–1032. - PMC - PubMed
MeSH terms
Grants and funding
LinkOut - more resources
Full Text Sources
Other Literature Sources
Medical
