. 2013 Nov;25(11):4405-20.
doi: 10.1105/tpc.113.116590. Epub 2013 Nov 22.

Blue light-dependent interaction between cryptochrome2 and CIB1 regulates transcription and leaf senescence in soybean

Affiliations

Blue light-dependent interaction between cryptochrome2 and CIB1 regulates transcription and leaf senescence in soybean

Yingying Meng et al. Plant Cell. 2013 Nov.

Abstract

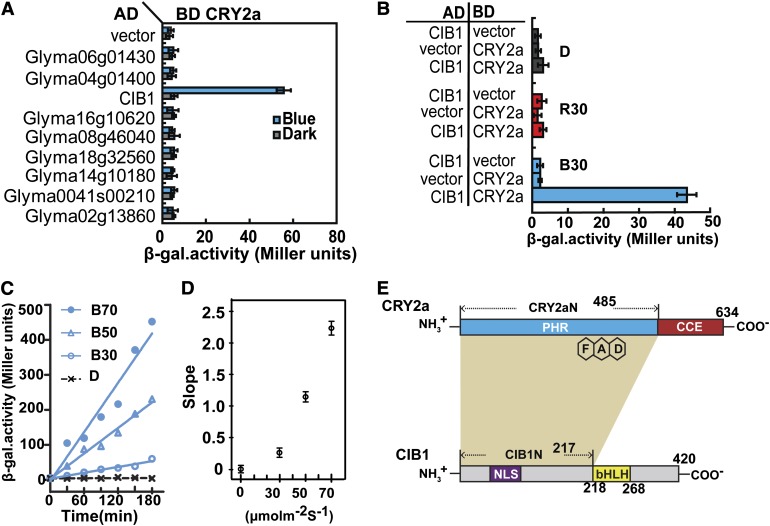
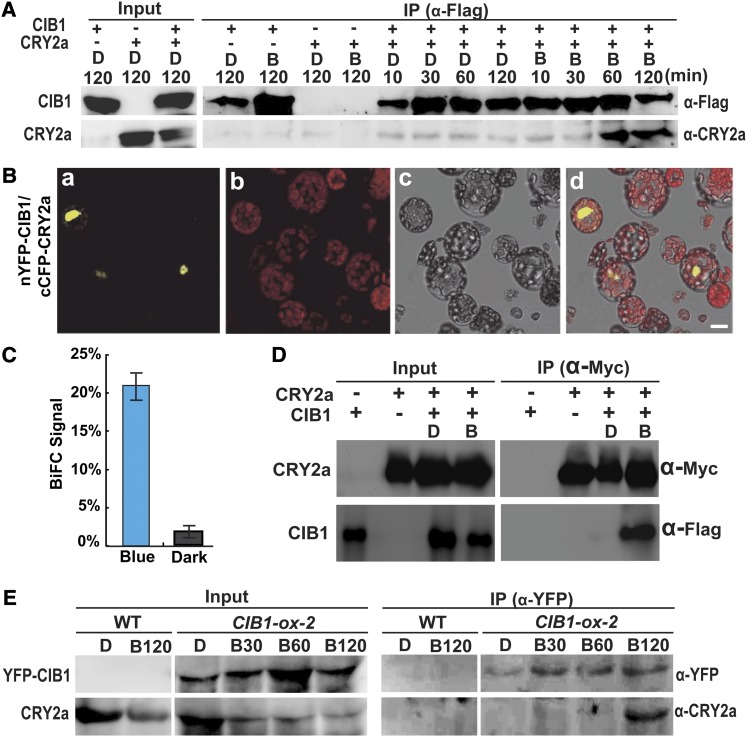
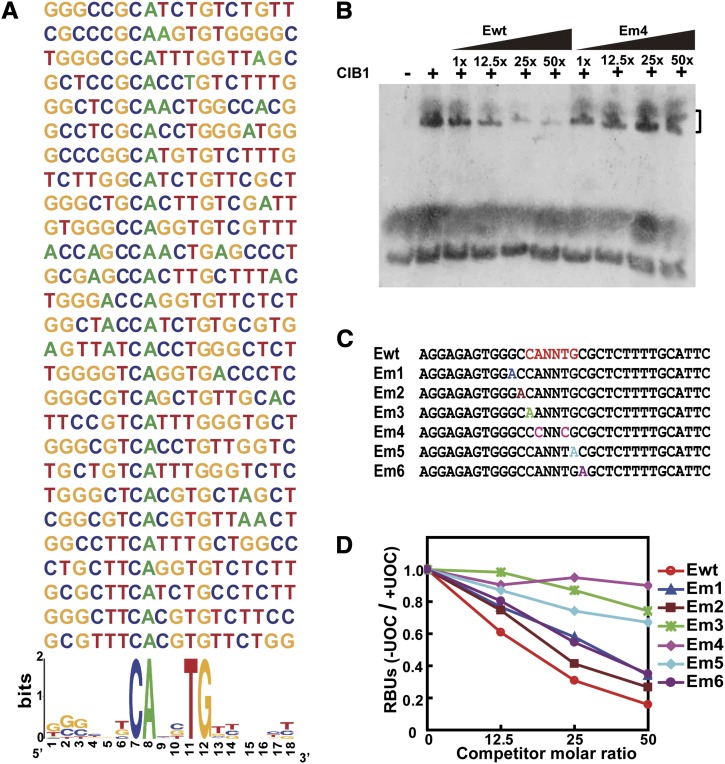
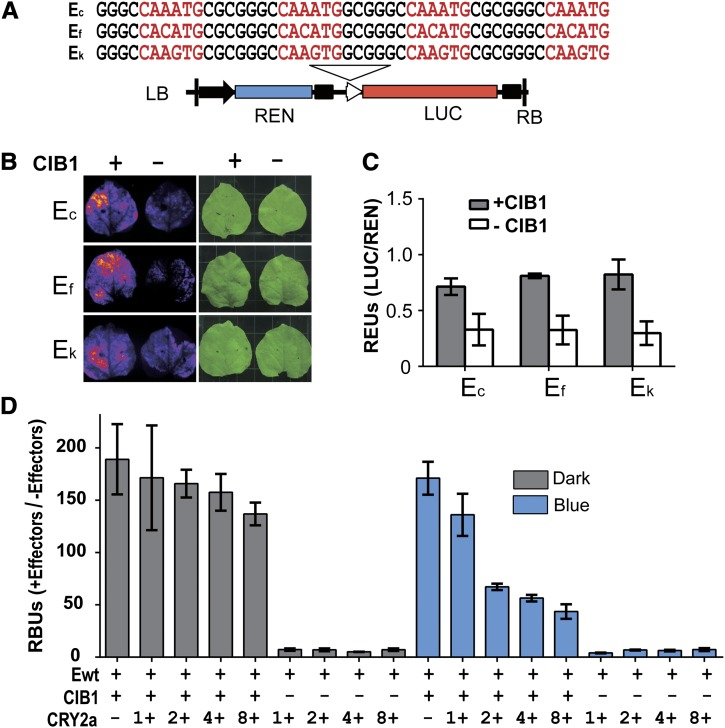
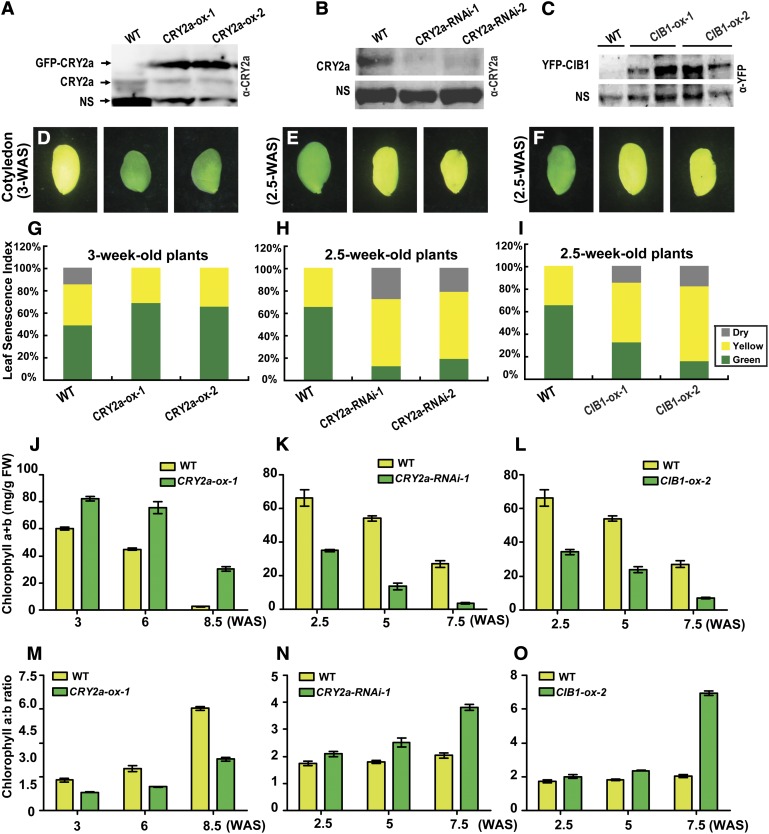
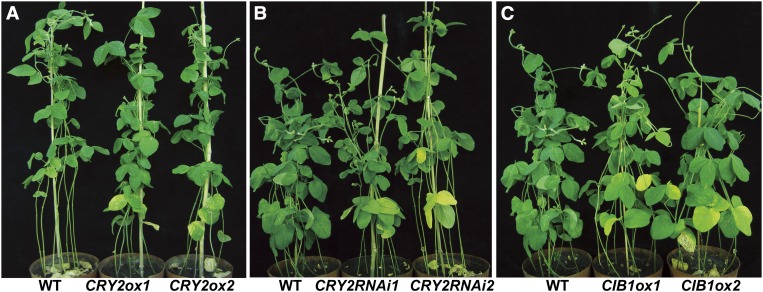
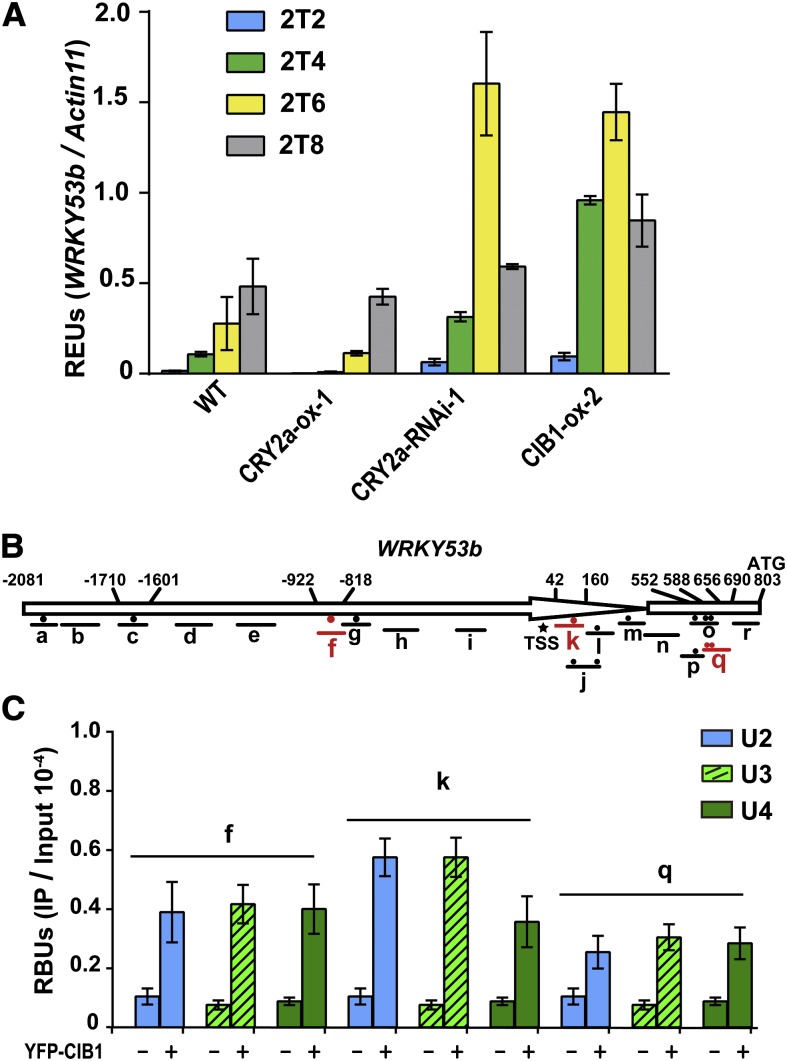
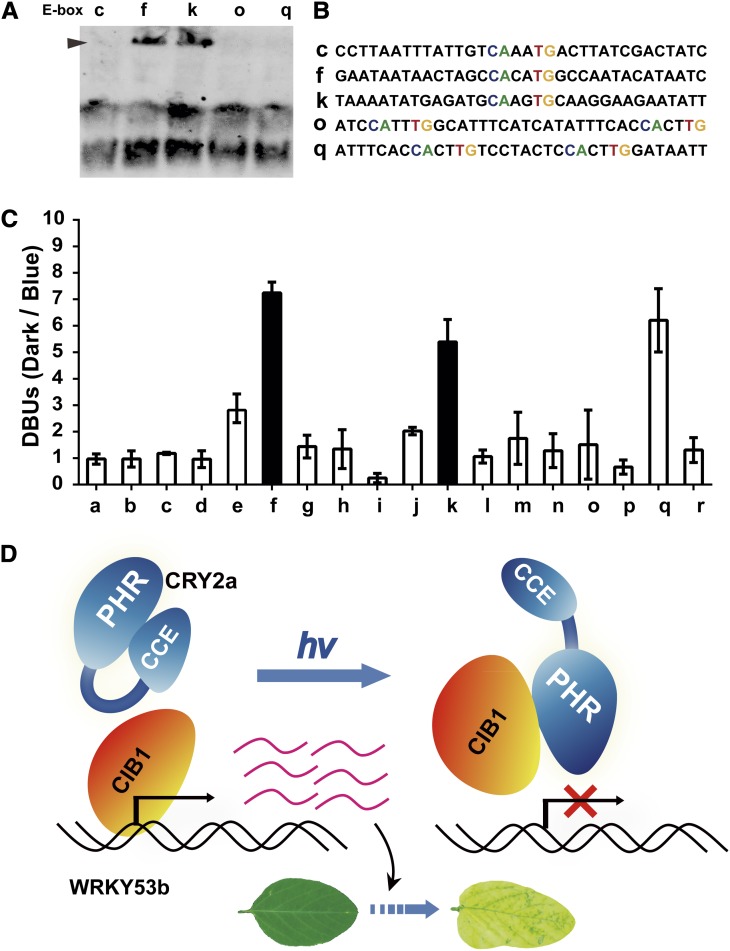
Cryptochromes are blue light receptors that regulate light responses in plants, including various crops. The molecular mechanism of plant cryptochromes has been extensively investigated in Arabidopsis thaliana, but it has not been reported in any crop species. Here, we report a study of the mechanism of soybean (Glycine max) cryptochrome2 (CRY2a). We found that CRY2a regulates leaf senescence, which is a life history trait regulated by light and photoperiods via previously unknown mechanisms. We show that CRY2a undergoes blue light-dependent interaction with the soybean basic helix-loop-helix transcription activator CIB1 (for cryptochrome-interacting bHLH1) that specifically interacts with the E-box (CANNTG) DNA sequences. Analyses of transgenic soybean plants expressing an elevated or reduced level of the CRY2a or CIB1 demonstrate that CIB1 promotes leaf senescence, whereas CRY2a suppresses leaf senescence. Results of the gene expression and molecular interaction analyses support the hypothesis that CIB1 activates transcription of senescence-associated genes, such as WRKY DNA BINDING PROTEIN53b (WRKY53b), and leaf senescence. CIB1 interacts with the E-box-containing promoter sequences of the WRKY53b chromatin, whereas photoexcited CRY2a interacts with CIB1 to inhibit its DNA binding activity. These findings argue that CIB-dependent transcriptional regulation is an evolutionarily conserved CRY-signaling mechanism in plants, and this mechanism is opted in evolution to mediate light regulation of different aspects of plant development in different plant species.


Figures

Figure 1.
Figure 1.
CRY2a Interacts with CIB1 in Response to Blue Light in Yeast Cells. (A) β-Gal assay showing the interaction of CRY2a with CIB1 and other bHLH homologs in yeast cells treated with blue light (30 μmol m−2 s−1) or darkness. AD, activation domain; BD, binding domain. (B) β-Gal assays showing the interaction of CRY2a and CIB1 in yeast cells treated with red light (R30, 30 μmol m−2 s−1), blue light (B30, 30 μmol m−2 s−1) or darkness (D) for 2 h. Yeast cells expressing various baits and preys are indicated. Means of three independent replicates and sd are shown ([A] and [B]). (C) β-Gal assay showing the interaction of CRY2a and CIB1 in response to blue light of different fluence rates (D, darkness; B30, 30 μmol m−2 s−1; B50, 50 μmol m−2 s−1; B70, 70 μmol m−2 s−1) for the durations indicated. Increased β-gal activities of the indicated samples fitted by linear regression are shown. (D) Slopes of linear regression curves of different fluence rates as shown in (C). The means (±sd) of three replicates of individual samples are plotted to show the metric of association kinetics in response to fluence rates of blue light (Jonckheere-Terpstra trend analysis by SPSS program, P = 0.003, n = 3). (E) Schematic representation depicting the domains of CRY2a and CIB1 that are required for the CRY2a–CIB1 interaction (ocher shade).
Figure 2.
Figure 2.
CRY2a Interacts with CIB1 in Response to Blue Light in Vitro and in Plant Cells. (A) A pull-down assay showing the blue light–dependent CRY2a–CIB1 interaction in vitro. Agarose beads conjugated with anti-Flag antibody (α-Flag) were mixed with the lysate of insect cells expressing 6His-CIB1-Flag (CIB1) and 6His-CRY2a (CRY2a). The mixture was treated with blue light (B, 22 μmol m−2 s−1) or darkness for the indicated durations. The bound proteins were eluted after washing and analyzed by immunoblots probed with anti-Flag antibody (α-Flag), stripped, and reprobed with anti-CRY2a antibody (α-CRY2a). IP, immunoprecipitation. (B) BiFC assay showing the blue light–dependent CRY2a–CIB1 interaction in Arabidopsis protoplasts cotransfected with the plasmids encoding nYFP-CIB1 and cCFP-CRY2a. The mesophyll protoplasts of 4-week-old plants grown in LD (16 h light/8 h dark) conditions were cotransformed with plasmids encoding the indicated proteins, incubated for 12 h in the dark, and then transferred to blue light (22 μmol m−2 s−1) for 30 min prior to the confocal microscopy analysis. Image a, YFP fluorescence; image b, autofluorescence; image c, bright field; image d, merge of images a to c. Bar = 10 µm. (C) The percentage of protoplasts that showed BiFC fluorescence signals was counted. Each sample contains at least 50 protoplasts. Means and sd (n = 3) are shown. P = 0.00026 (Student’s t test). (D) Ex vivo coimmunoprecipitation assay showing blue light–dependent formation of the CRY2a-CIB1 complex in N. benthamiana. Young leaves were infiltrated with Agrobacteria harboring the plasmids encoding CIB1-Flag (CIB1) or CRY2a-Myc (CRY2a) as indicated, kept in continuous white light for 2 d, moved to darkness for 1 d, and then exposed to blue light (B; 22 μmol m−2 s−1) for 1 h or kept in darkness (D). The protein extracts were incubated with the agarose conjugated with anti-Myc antibody at 4°C for 60 min. Beads were collected and washed three times prior to the elution of immunoprecipitation products. Immunoblots of the total protein extracts (Input) and the IP product were performed using the anti-Myc antibody (α-Myc) and anti-Flag antibody (α-Flag), sequentially. (E) Coimmunoprecipitation assays showing the blue light–dependent formation of the CRY2a-CIB1 complex in soybean. The wild-type (WT) soybean KN18 and a soybean transgenic line (line 2) overexpressing the Pro35S:YFP-CIB1 transgene (CIB1-ox-2) were grown in SD (8 h light/16 h dark) conditions for 2 weeks. Plants were transferred to darkness for 18 h and exposed to blue light (22 μmol m−2 s−1) for the time indicated periods of time (D, 0 min; B30, 30 min; B60, 60 min; B120, 120 min). Immunoblots of the protein extracts (Input) and the immunoprecipitation products using the agarose conjugated with anti-GFP antibody (α-GFP) were probed by anti-YFP antibody (α-YFP), stripped, and reprobed by anti-CRY2a antibody (α-CRY2a).
Figure 3.
Figure 3.
CIB1 Is a DNA Binding Protein Interacting with the E-Box (CANNTG) DNA Sequence. (A) The alignment of DNA sequences selected by CIB1 via the random binding site selection assay (see Methods). Over 80% sequences selected by CIB1 contain the E-box element (CANNTG) (http://weblogo.berkeley.edu/). (B) A competitive EMSA showing the interaction of CIB1 with the DIG-labeled E-box DNA. The CIB1–DNA interaction was completed by the unlabeled wild-type E-box (Ewt) or the mutant E-box (Em4) as shown in (C). Black wedges represent increasing amounts of competitors (12.5×, 25×, and 50× in molar excess). (C) The DNA sequences of the wild-type E-box DNA (Ewt) and mutant E-box sequence (Em) competitors. (D) A quantitative analysis of the competitive EMSA using the Ewt or Em competitors. Signals of the CIB1-bound probe in the presence of unlabeled oligonucleotide competitor (+UOC) are normalized by that in the absence of the unlabeled oligonucleotide competitor (-UOC) and presented as RBUs.
Figure 4.
Figure 4.
CIB1 Is a Transcription Activator Regulated by CRY2a in Response to Blue Light. (A) A diagram showing the structure of the E-box–driven dual-luciferase reporter gene and DNA sequence of the recombinant E-box elements. The DNA sequences (Ec, Ef, and Ek) containing four tandem-repeat E-box derived from the c, f, and k regions of WRKY53b chromatin (see Figure 7B). The 35S promoter (black arrow), 35S minimum promoter (white arrowhead), Renilla luciferase (REN), firefly luciferase (LUC), and T-DNA (left border [LB] and right border [RB] are indicated. (B) Images showing the LUC activities of N. benthamiana leaves infiltrated with the Agrobacteria strain harboring the indicated reporter (Ec, Ef, or Ek), in the presence (+) or absence (−) of the cotransfecting Agrobacteria strain harboring the plasmid expressing CIB1. After Agrobacteria infiltration, the plants were kept in white light for 3 d before photographs were taken. (C) Dual-luciferase assay of relative reporter activity of samples shown in (B). The relative LUC activities normalized to REN activity are presented as relative expression units (REUs). The sd is shown (n = 3). The P values of CIB1-dependent activation of the reporter expression of the Ec, Ef, or Ek recombinant promoters are 0.014, 0.003, or 0.006, respectively (Student’s t test). (D) Results of EMSA assay showing the inhibitory effect of CRY2a on the DNA binding activity of CIB1 to E-box DNA in response to blue light. The E-box DNA (Ewt) was mixed with effectors, which are the insect cell lysates expressing 6His-CIB1-Flag (CIB1) fusion protein and increased amount (1 to 8×) of lysates of insect cells expressing 6His-CRY2a (CRY2a). The mixtures containing the indicated components were incubated under blue light (25 μmol m−2 s−1) or in darkness at 4°C for 2 h. The mixture was mixed with agarose beads conjugated with anti-Flag antibody and washed five times with binding buffer, and the bound DNA was eluted by elution buffer and subjected to quantitative PCR. RBUs are defined in Methods. The significance of the CRY2a-dependent effects of the affinity of CIB1 for DNA in the presence or absence of blue light are examined by the Jonckheere-Terpstra Trend test; P = 0.912 or 0.003 of the dark-treated or the light-treated samples, respectively.
Figure 5.
Figure 5.
CRY2a and CIB1 Regulate Leaf Senescence. (A) to (C) Immunoblots showing the expression of GFP-CRY2a fusion protein or the endogenous CRY2a protein in CRY2a-ox plants, CRY2a-RNAi plants, and the wild-type (WT) controls or the expression of YFP-CIB1 fusion protein in CIB1-ox plants. Two independent lines of each genotype were examined. The total protein extracts were analyzed in a 10% SDS-PAGE gel for the immunoblot probed with α-CRY2a ([A] and [B]) or α-YFP antibodies. (C). The nonspecific bands (NS) recognized by the antibodies were used as the loading control. (D) to (F) Images of representative cotyledons of the indicated lines showing different extents of senescence at the indicated growth stages. (G) to (I) Cotyledons and unifoliolates were categorized into three groups according to their severities of senescence (green, nonsenescent; yellow, mildly senescent; gray, completely senescent) at the developmental stages indicated. The leaf senescence index is calculated as the percentage of each group with respect to the total leaf number of the individual plant (n ≥ 10). (J) to (O) A comparison of the chlorophyll content (chlorophyll a+b) ([J] to [L]) or chlorophyll a/b ratio ([M] to [O]) of leaves of CRY2a-ox-1 ([J] and [M]), CRY2a-RNAi-1 ([K] and [N]), CIB1-ox-2 ([L] and [O]), and the control (wild type, WT). Mixed samples of two unifoliolates and the first two trifoliolates of a plant grown in continuous white light at the indicated development stages were collected for both measurements. The means and sd (n = 3) are shown.
Figure 6.
Figure 6.
The Leaf Senescence Phenotype of the Wild Type and the Respective Transgenic Soybean Plants. (A) Transgenic soybean overexpressing CRY2a (CRY2ox) showed delayed leaf-senescence. The plants were grown in continuous light for 8.5 weeks. WT, the wild type. (B) Transgenic soybean expressing CRY2a-RNAi (CRY2RNAi) showed accelerated leaf senescence. The plants were grown in continuous light for 7.5 weeks. (C) Transgenic soybean overexpressing CIB1 (CIB1ox) showed accelerated leaf-senescence. The plants were grown in continuous light for 7.5 weeks.
Figure 7.
Figure 7.
CIB1 Binds to the WRKY53b Chromatin to Promote WRKY53b mRNA Expression. (A) Quantitative RT-PCR showing the RNA levels of WRKY53b in leaves of the indicated genotypes grown in continuous light. Relative expression units (REUs) were measured by normalization of the WRKY53b signal with that of the Actin11 control and are shown with the sd (n = 3). 2T2, 2T4, 2T6, or 2T8, the second trifoliolates collected from the plants at 2, 4, 6, or 8 WAS. The P values of differential expression of WRKY53b between the wild type (WT) and transgenic lines are 0.007, 0.046, 0.006, and 0.005 for CRY2a-ox (2 WAS), CRY2a-ox (6 WAS), CRY2a-RNAi (6 WAS), and CIB1-ox (6 WAS), respectively. (B) A diagram depicting the predicted promoter (arrow) and the 5′ untranslated region (white box) regions of WRKY53b. Black or red circles indicate the positions of E-boxes (CANNTG). Different regions of the 2880-bp WRKY53b genomic DNA examined in the ChIP-qPCR reaction are indicated, with the short lines representing the region between the respective primer pairs used in the ChIP-qPCR reaction. Asterisk indicates the putative transcription start site, and numbers depict the position (bp) upstream (+) or downstream (−) of TSS. (C) ChIP-qPCR analysis of samples collected from CIB1-ox-2 and wild-type plants at different developmental stages of the indicated chromatin region of WRKY53b. Plants were grown in continuous light. U2, U3, and U4 represent unifoliolates of the 2, 3, or 4 WAS stages. ChIP samples were prepared using anti-YFP antibody and subjected to quantitative PCR analysis. Results of ChIP-qPCR were quantified by normalization of the immunoprecipitation signal with the corresponding input signal. The sd is shown (n = 3). RBUs = PCR signal of immunoprecipitation reaction/PCR signal of input.
Figure 8.
Figure 8.
Blue Light Suppresses the Interaction of CIB1 with Specific Regions of WRKY53b Chromatin. (A) EMSA shows the direct interaction of CIB1 with the E-box sequences of the f and k regions of WRKY53b chromatin. See Figure 7 for the relative location of each region of the WRKY53b chromatin shown. (B) The sequences of DNA probes used in (A). (C) A comparison of the affinity of CIB1 for each region of the WRKY53b chromatin in response to blue light. Three-week-old plants grown in SD photoperiods (8 h light/16 h dark) were transferred to dark for 18 h, transferred to blue light (22 μmol m−2 s−1), or left in darkness until sample collection. The first trifoliolates were collected for ChIP analysis. DBUs were calculated by the formula: [IP of (CIB1/WT)/input of (CIB1/WT) of dark-treated sample]/[IP of (CIB1/WT)/input of (CIB1/WT) of blue light–treated sample], with sd (n = 3) shown. The light dependence of the interaction of CIB1 to the a, f, or k region of the WRKY53b chromatin has a P value of 0.8, 0.002, or 0.007, respectively (Student’s t tests). The f and k regions that show decreased interaction with CIB1 in response to blue light are highlighted by black. WT, the wild type. (D) A working model depicting CRY2a-mediated blue light suppression of the CIB1-dependent activation of leaf senescence. PHR, photolyase homologous region; CCE, CRY C-terminal extension.

References

    1. Ahmad M., Cashmore A.R. (1993). HY4 gene of A. thaliana encodes a protein with characteristics of a blue-light photoreceptor. Nature 366: 162–166 - PubMed
    1. Cashmore A.R. (2003). Cryptochromes: Enabling plants and animals to determine circadian time. Cell 114: 537–543 - PubMed
    1. Chaves I., Pokorny R., Byrdin M., Hoang N., Ritz T., Brettel K., Essen L.O., van der Horst G.T., Batschauer A., Ahmad M. (2011). The cryptochromes: Blue light photoreceptors in plants and animals. Annu. Rev. Plant Biol. 62: 335–364 - PubMed
    1. Endo M., Mochizuki N., Suzuki T., Nagatani A. (2007). CRYPTOCHROME2 in vascular bundles regulates flowering in Arabidopsis. Plant Cell 19: 84–93 - PMC - PubMed
    1. Griffin E.A., Jr, Staknis D., Weitz C.J. (1999). Light-independent role of CRY1 and CRY2 in the mammalian circadian clock. Science 286: 768–771 - PubMed

Publication types

MeSH terms