

Projecting the effect of changes in smoking and obesity on future life expectancy in the United States
- PMID: 24272710
- PMCID: PMC4495773
- DOI: 10.1007/s13524-013-0246-9
Projecting the effect of changes in smoking and obesity on future life expectancy in the United States
Abstract
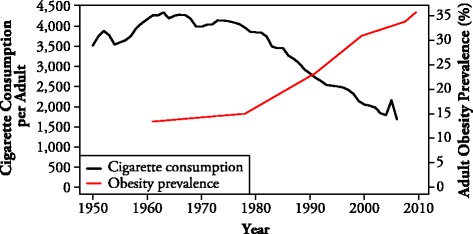
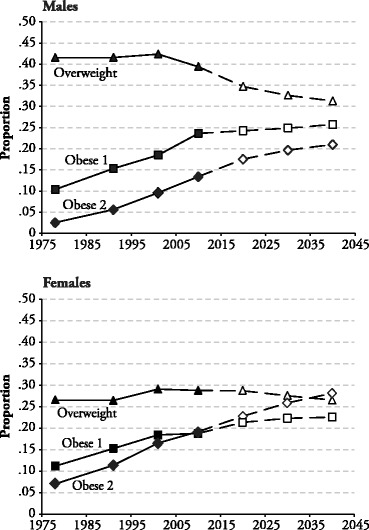
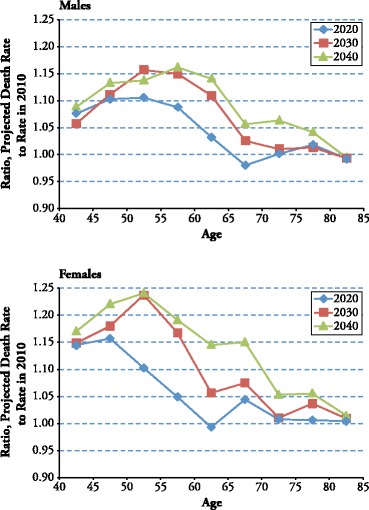
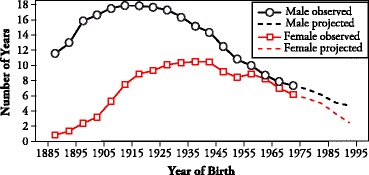
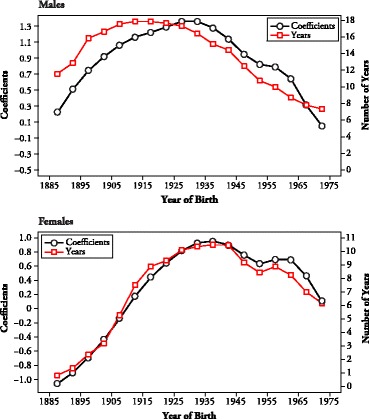
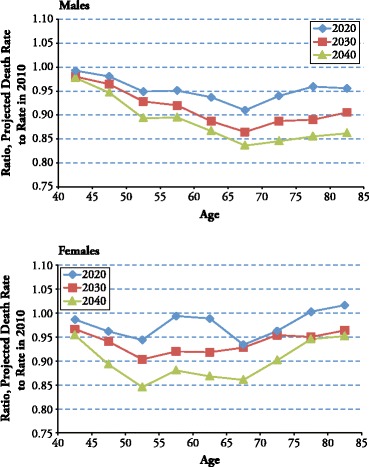
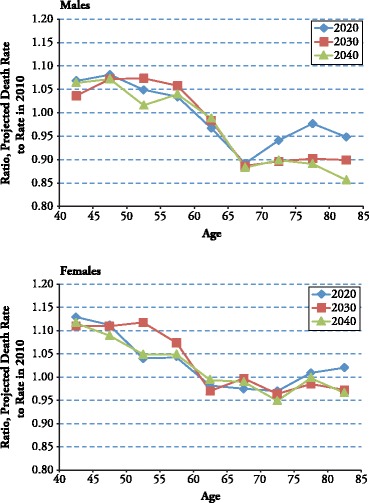
We estimate the effects of declining smoking and increasing obesity on mortality in the United States over the period 2010-2040. Data on cohort behavioral histories are integrated into these estimates. Future distributions of body mass indices are projected using transition matrices applied to the initial distribution in 2010. In addition to projections of current obesity, we project distributions of obesity when cohorts are age 25. To these distributions, we apply death rates by current and age-25 obesity status observed in the National Health and Nutrition Examination Survey, 1988-2006. Estimates of the effects of smoking changes are based on observed relations between cohort smoking patterns and cohort death rates from lung cancer. We find that changes in both smoking and obesity are expected to have large effects on U.S. mortality. For males, the reductions in smoking have larger effects than the rise in obesity throughout the projection period. By 2040, male life expectancy at age 40 is expected to have gained 0.83 years from the combined effects. Among women, however, the two sets of effects largely offset one another throughout the projection period, with a small gain of 0.09 years expected by 2040.
Figures
References
-
- Allison DB, Heo M, Fontaine KR, Hoffman DJ. Body weight, body composition, and longevity. In: Bjorntorp P, editor. International textbook of obesity. West Sussex, UK: John Wiley & Sons; 2001. pp. 31–48.
-
- Baum, C. L., & Chou S-Y. (2011). The socio-economic causes of obesity (NBER Working Paper No. 17423). Cambridge, MA: National Bureau of Economic Research.
-
- Bell, F. C., & Miller, M. L. (2005). Life tables for the United States Social Security area 1900–2100 (Actuarial Study No. 120). Washington, DC: Social Security Administration.
Publication types
MeSH terms
Grants and funding
LinkOut - more resources
Full Text Sources
Other Literature Sources
Medical
