Review
. 2013 Nov 11:4:165.
doi: 10.3389/fendo.2013.00165. eCollection 2013.

GABA and Glutamate Transporters in Brain

Affiliations
Review

GABA and Glutamate Transporters in Brain

Yun Zhou et al. Front Endocrinol (Lausanne). .

Abstract

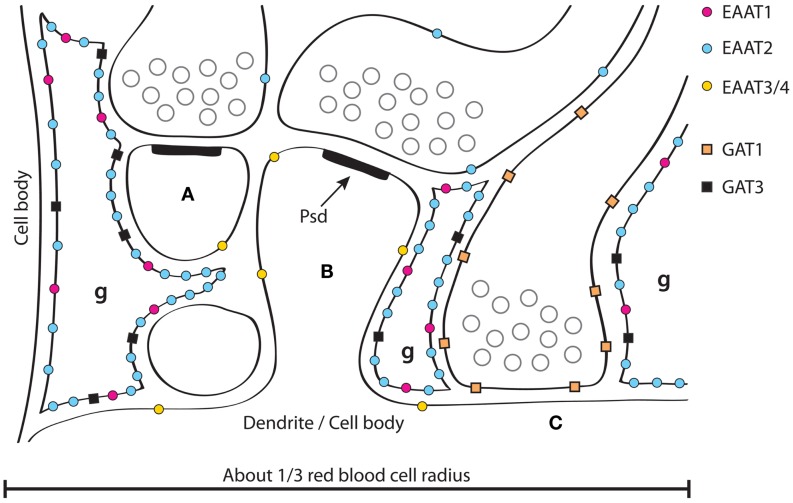
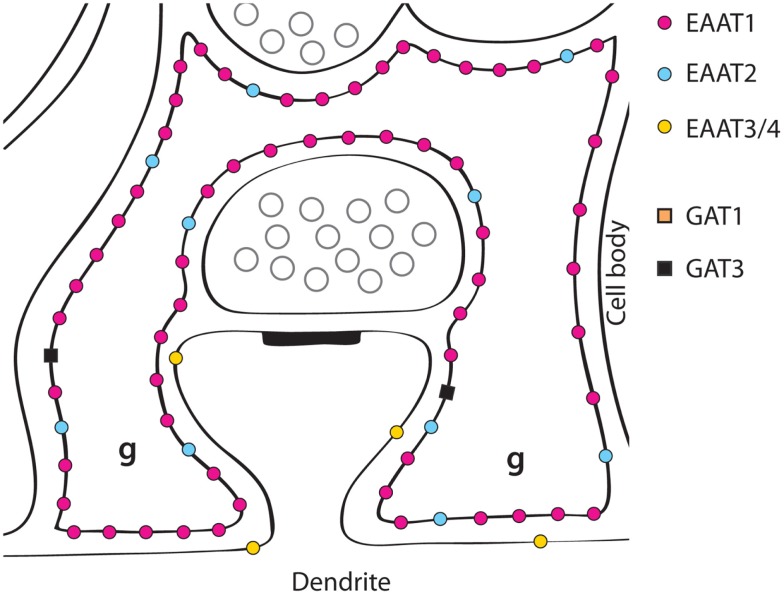
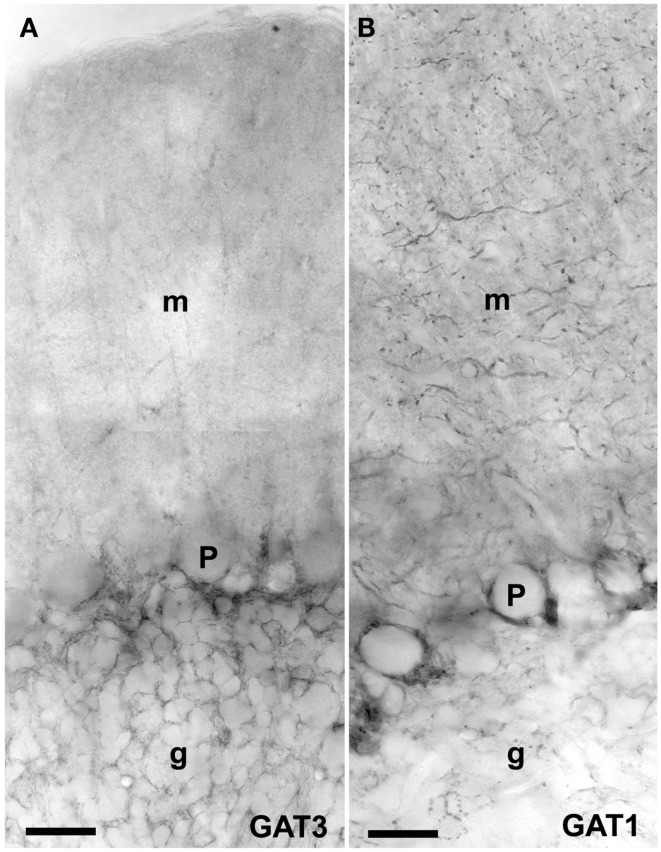
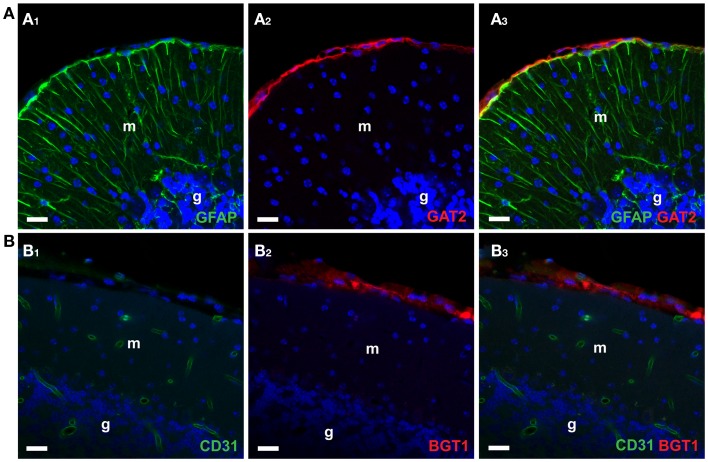
The mammalian genome contains four genes encoding GABA transporters (GAT1, slc6a1; GAT2, slc6a13; GAT3, slc6a11; BGT1, slc6a12) and five glutamate transporter genes (EAAT1, slc1a3; EAAT2, slc1a2; EAAT3, slc1a1; EAAT4, slc1a6; EAAT5, slc1a7). These transporters keep the extracellular levels of GABA and excitatory amino acids low and provide amino acids for metabolic purposes. The various transporters have different properties both with respect to their transport functions and with respect to their ability to act as ion channels. Further, they are differentially regulated. To understand the physiological roles of the individual transporter subtypes, it is necessary to obtain information on their distributions and expression levels. Quantitative data are important as the functional capacity is limited by the number of transporter molecules. The most important and most abundant transporters for removal of transmitter glutamate in the brain are EAAT2 (GLT-1) and EAAT1 (GLAST), while GAT1 and GAT3 are the major GABA transporters in the brain. EAAT3 (EAAC1) does not appear to play a role in signal transduction, but plays other roles. Due to their high uncoupled anion conductance, EAAT4 and EAAT5 seem to be acting more like inhibitory glutamate receptors than as glutamate transporters. GAT2 and BGT1 are primarily expressed in the liver and kidney, but are also found in the leptomeninges, while the levels in brain tissue proper are too low to have any impact on GABA removal, at least in normal young adult mice. The present review will provide summary of what is currently known and will also discuss some methodological pitfalls.

Keywords: BGT1; EAAT1; EAAT2; GABA uptake; GAT1; GAT2; GAT3; glutamate uptake.


Figures

Figure 1
Figure 1
A schematic illustration of GABA and glutamate transporter distributions around synapses in the hippocampus. Two glutamatergic synapses (A,B) are shown forming synapses asymmetric specializations with prominent post synaptic densities (PSD, one of which is labeled). GABAergic synapses (C) are often onto dendritic trunks rather than spines, and the synaptic specializations are typically symmetric. Three fine astrocyte branches are indicated (g). Note that the synapses in the hippocampus are usually not surrounded by astrocytes, but rather contacted by an astrocyte (like a finger pointing to it, and typically from the postsynaptic side). Also note that there are no astrocytes between synapse (A,B). About 1/3 of neighboring synapses in the hippocampus have no astrocytes between them in contrast to the molecular layer of the cerebellum where most synapses onto spines are typically completely surrounded by astrocytes (Figure 2) and thereby isolated from their neighbors (162, 275). Glutamate and GABA transporters are indicated. EAAT1 (184, 185) and GAT3 (, , –177) are selective for astrocytes, while EAAT2 is predominantly expressed in astrocytes (59), but there is also some (about 10%) in hippocampal nerve terminals (229). This has some resemblance to GAT1 as GAT1 is mostly neuronal (–173), but with some expression in astrocytes; particularly in the thalamus (172). There is more EAAT2 than EAAT1 in the hippocampus and the other way around in the cerebellum (162, 184). EAAT3 is selective for neurons, but is expressed at levels two orders of magnitude lower than EAAT2 and is targeted to dendrites and cell bodies (193) (Copyright: Neurotransporter.org; Reproduced with permission).
Figure 2
Figure 2
A schematic illustration of glutamate transporter distributions around parallel fiber synapses on Purkinje cell spines in the molecular layer of the cerebellum. EAAT1 is expressed in the astrocytes (Bergmann glial cells) at very high levels, and about six times higher than EAAT2 (162, 184). Most of the EAAT4 protein is found in cerebellar Purkinje cells (the glia-covered parts of the membranes of Purkinje cell dendrites), but low levels are also found in scattered neurons in the neocortex (123). EAAT3 is also found in the Purkinje cell dendrites, as well as in the other neuron types present, but at low levels (193) (Copyright: Neurotransporter.org; Reproduced with permission).
Figure 3
Figure 3
Peroxidase labeling of GAT3 (A) and GAT1 (B) in the cerebellum [as described Ref. (175, 276)]. GAT1 (slc6a1) and GAT3 (slc6a11) are the two GABA transporters that are functionally relevant for brain function, and these transporters are not expressed in the liver and kidney (181). GAT1 is mostly localized in axonal terminals in molecular layer (m) and GAT3 is in astroglial processes in granular layer (g). Note very high levels of GAT1 in basket cell terminals around the Purkinje cells (P). Scale bar: 20 μm (Copyright: Neurotransporter.org; Reproduced with permission).
Figure 4
Figure 4
Confocal imaging of GAT2 and BGT1 protein in the cerebellum [as described Ref. (106, 181)]. (A1–A3) Show double labeling for GAT2 (red) and the astroglial marker GFAP (green). (B1–B3) Show double labeling for BGT1 (red) and the endothelial marker CD31 (green). The nuclei were visualized in blue by DAPI. Note that both GAT2 and BGT1 are found at the leptomeninges external to glia limitans. Also note that there is no co-localization of GAT2 with GFAP, and no co-localization of BGT1 with endothelial marker. In fact, BGT1 (106, 167) and GAT2 (181) are hardly expressed in the brain at all, but are highly expressed in the liver and kidney. Abbreviations: m, molecular layer; g, granular layer. Scale bar: 20 μm (Copyright: Neurotransporter.org; Reproduced with permission).

References

    1. Fonnum F. Glutamate: a neurotransmitter in mammalian brain. J Neurochem (1984) 42:1–1110.1111/j.1471-4159.1984.tb09689.x - DOI - PubMed
    1. Krnjevic K. How does a little acronym become a big transmitter? Biochem Pharmacol (2004) 68:1549–5510.1016/j.bcp.2004.06.038 - DOI - PubMed
    1. Danbolt NC. Glutamate uptake. Prog Neurobiol (2001) 65:1–10510.1016/S0301-0082(00)00067-8 - DOI - PubMed
    1. Hamilton NB, Attwell D. Do astrocytes really exocytose neurotransmitters? Nat Rev Neurosci (2010) 11:227–3810.1038/nrn2803 - DOI - PubMed
    1. Cahoy JD, Emery B, Kaushal A, Foo LC, Zamanian JL, Christopherson KS, et al. A transcriptome database for astrocytes, neurons, and oligodendrocytes: a new resource for understanding brain development and function. J Neurosci (2008) 28:264–7810.1523/JNEUROSCI.4178-07.2008 - DOI - PMC - PubMed

LinkOut - more resources