

Microbes in nature are limited by carbon and energy: the starving-survival lifestyle in soil and consequences for estimating microbial rates
- PMID: 24273534
- PMCID: PMC3824246
- DOI: 10.3389/fmicb.2013.00324
Microbes in nature are limited by carbon and energy: the starving-survival lifestyle in soil and consequences for estimating microbial rates
Abstract
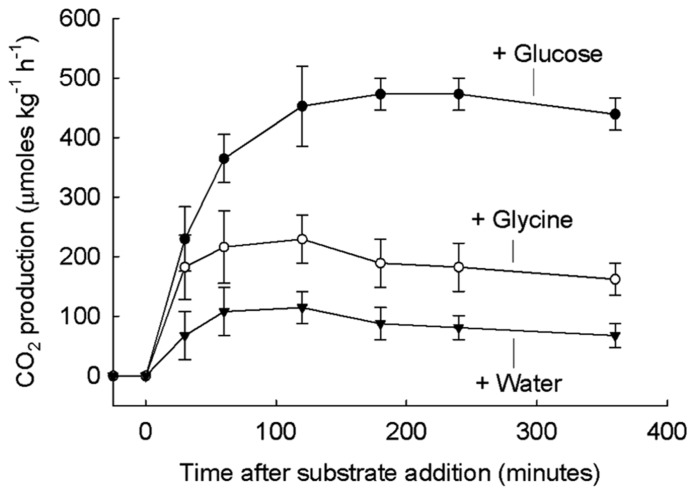
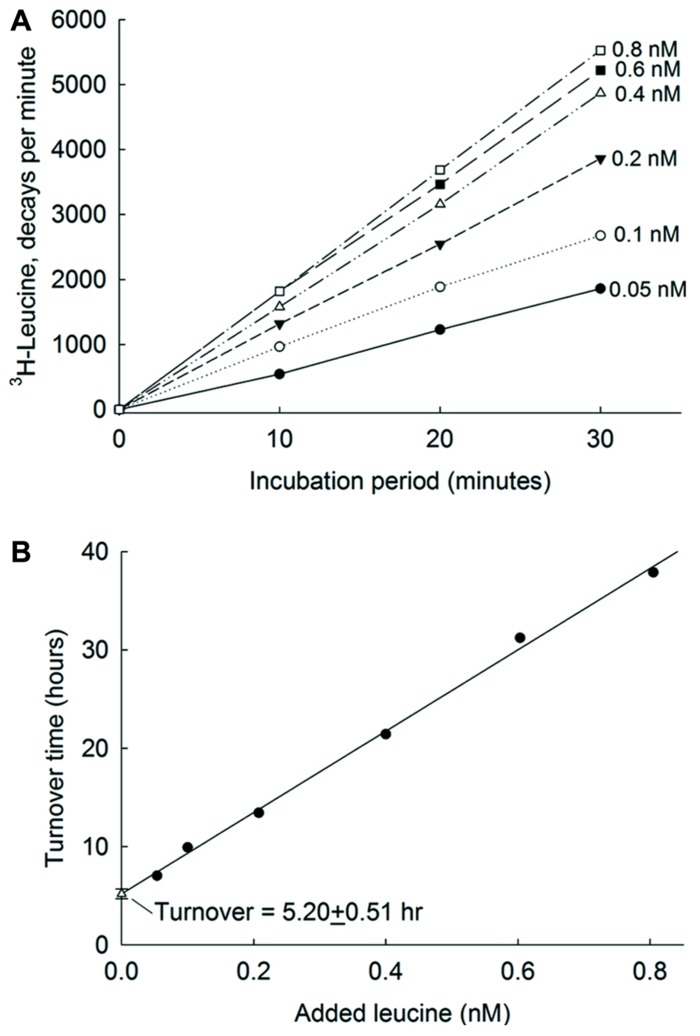
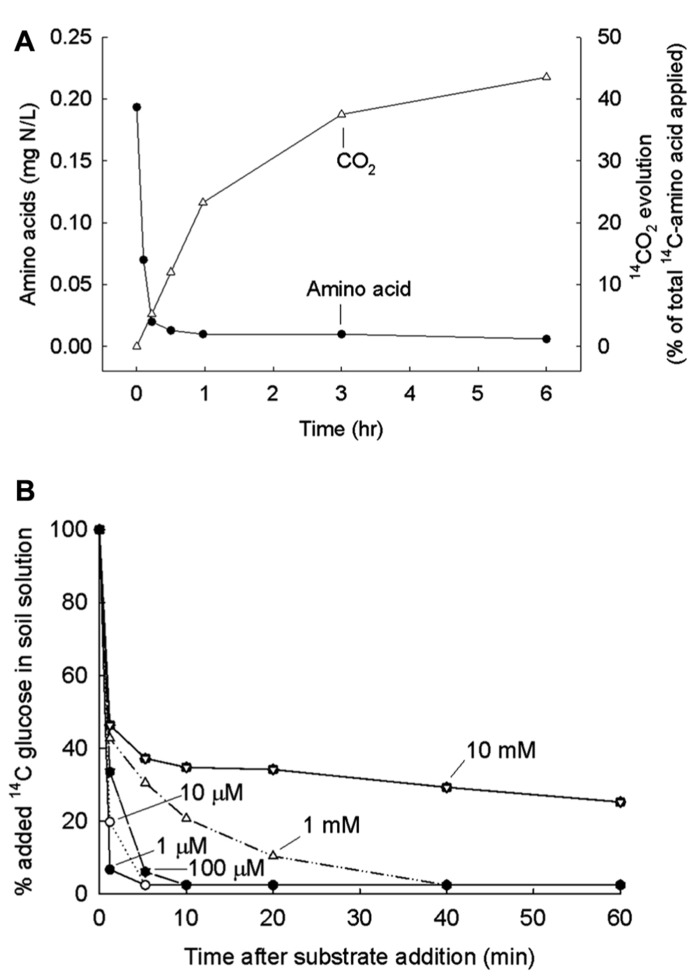
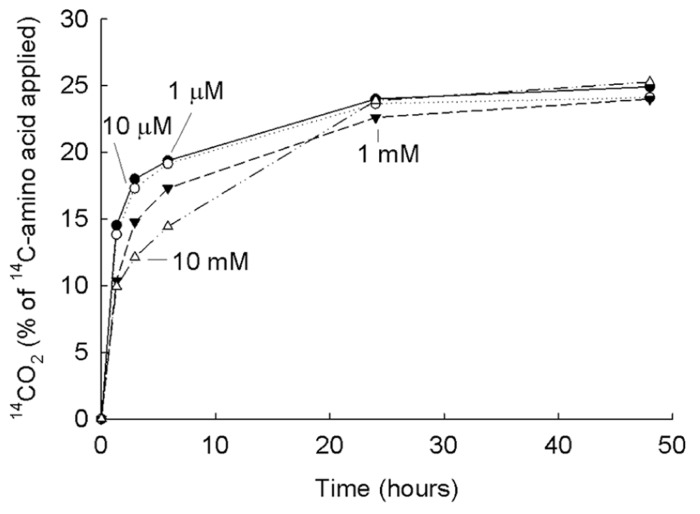
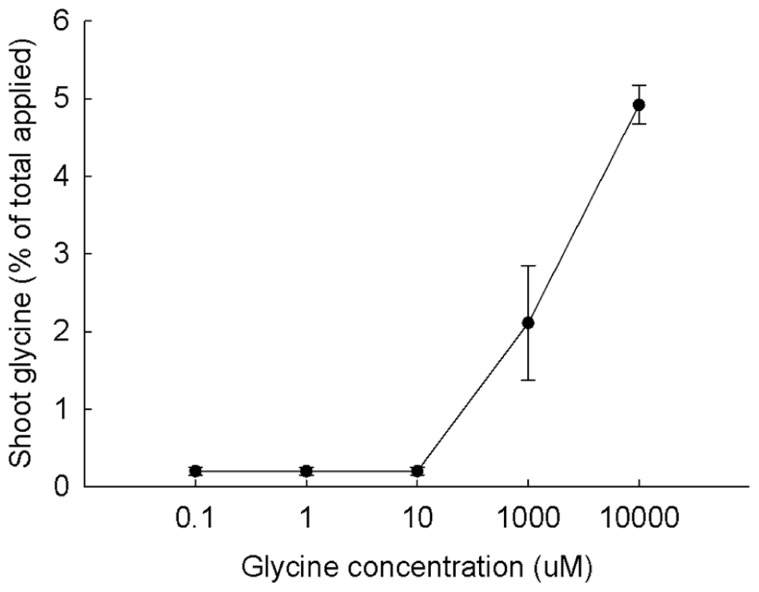
Understanding microbial transformations in soils is important for predicting future carbon sequestration and nutrient cycling. This review questions some methods of assessing one key microbial process, the uptake of labile organic compounds. First, soil microbes have a starving-survival life style of dormancy, arrested activity, and low activity. Yet they are very abundant and remain poised to completely take up all substrates that become available. As a result, dilution assays with the addition of labeled substrates cannot be used. When labeled substrates are transformed into (14)CO2, the first part of the biphasic release follows metabolic rules and is not affected by the environment. As a consequence, when identical amounts of isotopically substrates are added to soils from different climate zones, the same percentage of the substrate is respired and the same half-life of the respired (14)CO2 from the labeled substrate is estimated. Second, when soils are sampled by a variety of methods from taking 10 cm diameter cores to millimeter-scale dialysis chambers, amino acids (and other organic compounds) appear to be released by the severing of fine roots and mycorrhizal networks as well as from pressing or centrifuging treatments. As a result of disturbance as well as of natural root release, concentrations of individual amino acids of ~10 μM are measured. This contrasts with concentrations of a few nanomolar found in aquatic systems and raises questions about possible differences in the bacterial strategy between aquatic and soil ecosystems. The small size of the hyphae (2-10 μm diameter) and of the fine roots (0.2-2 mm diameter), make it very difficult to sample any volume of soil without introducing artifacts. Third, when micromolar amounts of labeled amino acids are added to soil, some of the isotope enters plant roots. This may be an artifact of the high micromolar concentrations applied.
Keywords: activity; amino acids; labeled substrate; microbes; soil; sugars; water.
Figures
References
-
- Alonso-Sàez L., Gasol J. M., Aristegui J., Vilas J. C., Vaque D., Duarte C. M., et al. (2007). Large-scale variability in surface bacterial carbon demand and growth efficiency in the subtropical northeast Atlantic Ocean. Limnol. Oceanogr. 52 533–54610.4319/lo.2007.52.2.0533 - DOI
-
- Bååth E. (1994). Measurement of protein synthesis by soil bacterial assemblages with the leucine incorporation technique. Biol. Fertil. Soils 7 147–15310.1007/BF00337747 - DOI
-
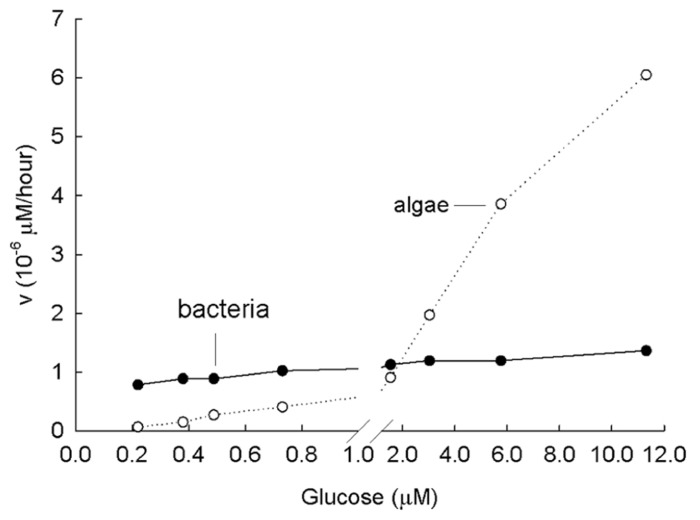
- Bennett M. E., Hobbie J. E. (1972). The uptake of glucose by Chlamydomonas sp. J. Phycol. 8 392–398
-
- Brookes P. C., Tate K. R., Jenkinson D. S. (1983). The adenylate energy-charge of the soil microbial biomass. Soil Biol. Biochem. 15 9–16 10.1016/0038-0717(83)90112-90118 - DOI
Publication types
LinkOut - more resources
Full Text Sources
Other Literature Sources
Research Materials