

Cortical inhibition deficits in recent onset PTSD after a single prolonged trauma exposure
- PMID: 24273707
- PMCID: PMC3815016
- DOI: 10.1016/j.nicl.2013.08.013
Cortical inhibition deficits in recent onset PTSD after a single prolonged trauma exposure
Abstract
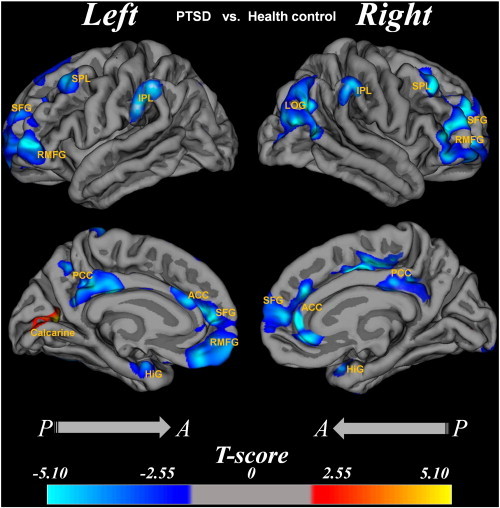
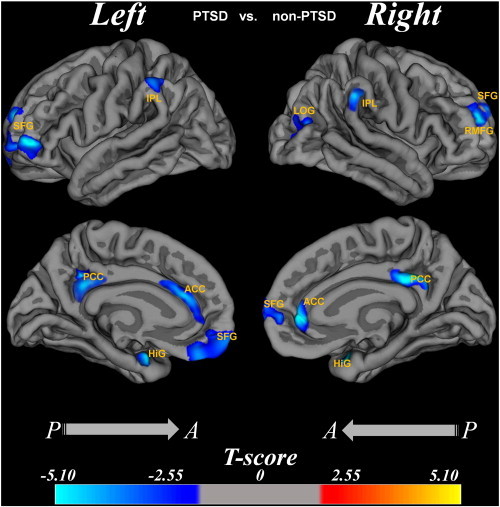
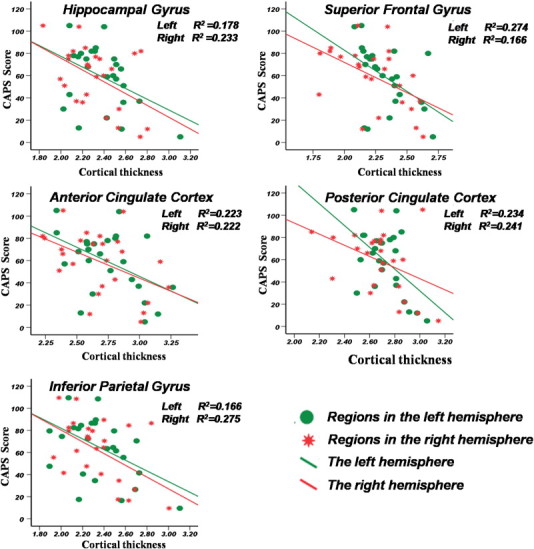
A variety of structural abnormalities have been described in post traumatic stress disorder (PTSD), but only a few studies have focused on cortical thickness alterations in recent onset PTSD. In this study, we adopted surface-based morphometry (SBM), which enables an exploration of global structural changes throughout the brain, in order to compare cortical thickness alterations in recent onset PTSD patients, trauma-exposed subjects but without PTSD, and normal controls. Moreover, we used region of interest (ROI) partial correlation analysis to evaluate the correlation among PTSD symptom severity and significant changes of cortical thickness. The widespread cortical thickness reduction relative to the normal controls were found in bilateral inferior and superior parietal lobes, frontal lobes, hippocampus, cingulate cortex, and right lateral occipital lobes in trauma survivors, whereas cortical thickness was only increased in left calcarine cortex in PTSD group. The average cortical thickness of hippocampus and cingulate cortex decreased by 10.75% and 9.09% in PTSD, 3.48% and 2.86% in non PTSD. We further demonstrated that the cortical thicknesses of bilateral ACC and PCC, superior frontal lobes, and hippocampus are negatively correlated with CAPS scores in all trauma survivors. Our study results suggest that stress widens cortical thinning regions and causes more serious effect in recent onset PTSD than non PTSD. It also shows that the cortical thinning in recent onset PTSD predicts the symptom severity.
Keywords: Cortical thickness; Recent onset PTSD; Surface-based morphometry.
Figures
Similar articles
-
Different regional gray matter loss in recent onset PTSD and non PTSD after a single prolonged trauma exposure.PLoS One. 2012;7(11):e48298. doi: 10.1371/journal.pone.0048298. Epub 2012 Nov 14. PLoS One. 2012. PMID: 23155380 Free PMC article.
-
Cortical thinning in patients with recent onset post-traumatic stress disorder after a single prolonged trauma exposure.PLoS One. 2012;7(6):e39025. doi: 10.1371/journal.pone.0039025. Epub 2012 Jun 13. PLoS One. 2012. PMID: 22720021 Free PMC article.
-
Decreased gray matter volume in the left hippocampus and bilateral calcarine cortex in coal mine flood disaster survivors with recent onset PTSD.Psychiatry Res. 2011 May 31;192(2):84-90. doi: 10.1016/j.pscychresns.2010.09.001. Epub 2011 Apr 17. Psychiatry Res. 2011. PMID: 21498053
-
Cortical thickness abnormalities in patients with post-traumatic stress disorder: A vertex-based meta-analysis.Neurosci Biobehav Rev. 2022 Mar;134:104519. doi: 10.1016/j.neubiorev.2021.104519. Epub 2022 Jan 1. Neurosci Biobehav Rev. 2022. PMID: 34979190 Review.
-
Trauma-specific Grey Matter Alterations in PTSD.Sci Rep. 2016 Sep 21;6:33748. doi: 10.1038/srep33748. Sci Rep. 2016. PMID: 27651030 Free PMC article. Review.
Cited by
-
Increased medial prefrontal cortical thickness and resilience to traumatic experiences in North Korean refugees.Sci Rep. 2021 Jul 21;11(1):14910. doi: 10.1038/s41598-021-94452-6. Sci Rep. 2021. PMID: 34290327 Free PMC article.
-
Alterations in hippocampal subfield and amygdala subregion volumes in posttraumatic subjects with and without posttraumatic stress disorder.Hum Brain Mapp. 2021 May;42(7):2147-2158. doi: 10.1002/hbm.25356. Epub 2021 Feb 10. Hum Brain Mapp. 2021. PMID: 33566375 Free PMC article.
-
Genetic and Neuroimaging Approaches to Understanding Post-Traumatic Stress Disorder.Int J Mol Sci. 2020 Jun 24;21(12):4503. doi: 10.3390/ijms21124503. Int J Mol Sci. 2020. PMID: 32599917 Free PMC article. Review.
-
Examining the association between posttraumatic stress disorder and disruptions in cortical networks identified using data-driven methods.Neuropsychopharmacology. 2024 Feb;49(3):609-619. doi: 10.1038/s41386-023-01763-5. Epub 2023 Nov 28. Neuropsychopharmacology. 2024. PMID: 38017161 Free PMC article.
-
Alteration of prefrontal cortex and its associations with emotional and cognitive dysfunctions in adolescent borderline personality disorder.Eur Child Adolesc Psychiatry. 2024 Nov;33(11):3937-3949. doi: 10.1007/s00787-024-02438-2. Epub 2024 Apr 20. Eur Child Adolesc Psychiatry. 2024. PMID: 38642117
References
-
- Anon. Guidelines for psychiatric practice in public sector psychiatric inpatient facilities. Committee on State and Community Psychiatric Systems of the Council on Psychiatric Services. American Psychiatric Association. Am. J. Psychiatry. 1994;151:797–798. - PubMed
-
- Bekes V. The etiological models of posttraumatic stress disorder. Psychiatr. Hung. 2010;25:133–141. - PubMed
Grants and funding
LinkOut - more resources
Full Text Sources
Other Literature Sources
Miscellaneous
