

Clustering of transcriptional profiles identifies changes to insulin signaling as an early event in a mouse model of Alzheimer's disease
- PMID: 24274089
- PMCID: PMC3907022
- DOI: 10.1186/1471-2164-14-831
Clustering of transcriptional profiles identifies changes to insulin signaling as an early event in a mouse model of Alzheimer's disease
Abstract
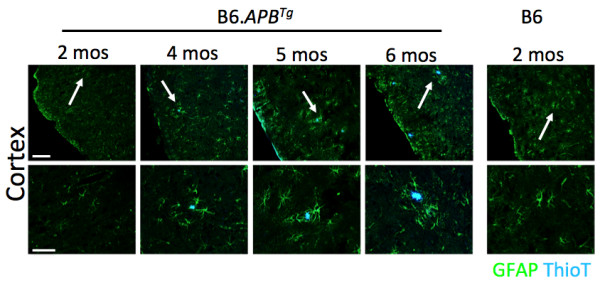
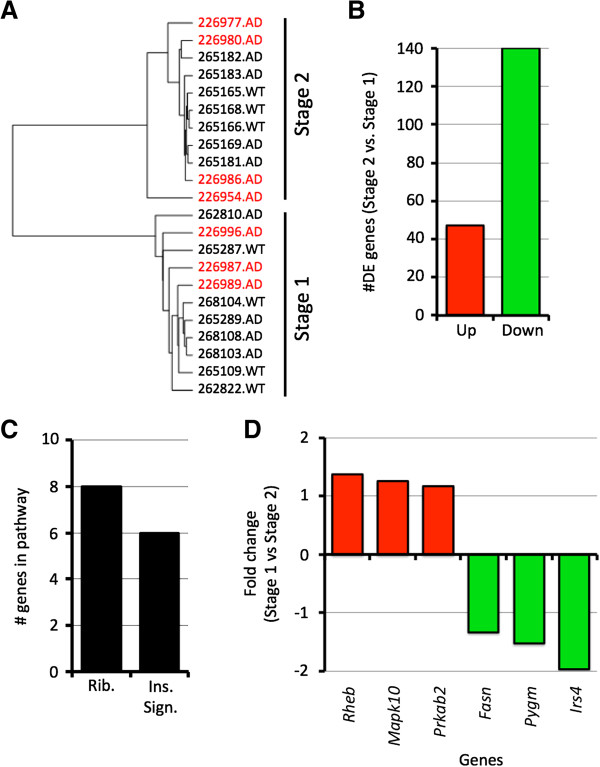
Background: Alzheimer's disease affects more than 35 million people worldwide but there is no known cure. Age is the strongest risk factor for Alzheimer's disease but it is not clear how age-related changes impact the disease. Here, we used a mouse model of Alzheimer's disease to identify age-specific changes that occur prior to and at the onset of traditional Alzheimer-related phenotypes including amyloid plaque formation. To identify these early events we used transcriptional profiling of mouse brains combined with computational approaches including singular value decomposition and hierarchical clustering.
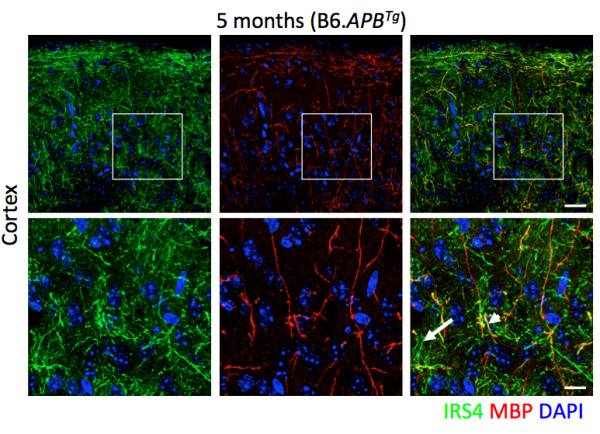
Results: Our study identifies three key events in early stages of Alzheimer's disease. First, the most important drivers of Alzheimer's disease onset in these mice are age-specific changes. These include perturbations of the ribosome and oxidative phosphorylation pathways. Second, the earliest detectable disease-specific changes occur to genes commonly associated with the hypothalamic-adrenal-pituitary (HPA) axis. These include the down-regulation of genes relating to metabolism, depression and appetite. Finally, insulin signaling, in particular the down-regulation of the insulin receptor substrate 4 (Irs4) gene, may be an important event in the transition from age-related changes to Alzheimer's disease specific-changes.
Conclusion: A combination of transcriptional profiling combined with computational analyses has uncovered novel features relevant to Alzheimer's disease in a widely used mouse model and offers avenues for further exploration into early stages of AD.
Figures


Similar articles
-
Role of Hypothalamic-Pituitary-Adrenal Axis, Hypothalamic-Pituitary-Gonadal Axis and Insulin Signaling in the Pathophysiology of Alzheimer's Disease.Neuropsychobiology. 2019;77(4):197-205. doi: 10.1159/000495521. Epub 2019 Jan 3. Neuropsychobiology. 2019. PMID: 30605907 Review.
-
Human Alzheimer's disease gene expression signatures and immune profile in APP mouse models: a discrete transcriptomic view of Aβ plaque pathology.J Neuroinflammation. 2018 Sep 6;15(1):256. doi: 10.1186/s12974-018-1265-7. J Neuroinflammation. 2018. PMID: 30189875 Free PMC article.
-
The diabetes drug liraglutide ameliorates aberrant insulin receptor localisation and signalling in parallel with decreasing both amyloid-β plaque and glial pathology in a mouse model of Alzheimer's disease.Neuromolecular Med. 2013 Mar;15(1):102-14. doi: 10.1007/s12017-012-8199-5. Epub 2012 Sep 21. Neuromolecular Med. 2013. PMID: 23011726
-
Early alterations in energy metabolism in the hippocampus of APPswe/PS1dE9 mouse model of Alzheimer's disease.Biochim Biophys Acta. 2014 Sep;1842(9):1556-66. doi: 10.1016/j.bbadis.2014.05.025. Epub 2014 Jun 2. Biochim Biophys Acta. 2014. PMID: 24887203
-
Glucose Metabolic Abnormality: A Crosstalk between Depression and Alzheimer's Disease.Curr Neuropharmacol. 2025;23(7):757-770. doi: 10.2174/011570159X343281240912190309. Curr Neuropharmacol. 2025. PMID: 39318215 Free PMC article. Review.
Cited by
-
Toward more predictive genetic mouse models of Alzheimer's disease.Brain Res Bull. 2016 Apr;122:1-11. doi: 10.1016/j.brainresbull.2015.12.003. Epub 2015 Dec 17. Brain Res Bull. 2016. PMID: 26708939 Free PMC article. Review.
-
Photobiomodulation modulates mitochondrial energy metabolism and ameliorates neurological damage in an APP/PS1 mousmodel of Alzheimer's disease.Alzheimers Res Ther. 2025 Apr 5;17(1):72. doi: 10.1186/s13195-025-01714-w. Alzheimers Res Ther. 2025. PMID: 40188044 Free PMC article.
-
Gut microbiota-driven metabolic alterations reveal gut-brain communication in Alzheimer's disease model mice.Gut Microbes. 2024 Jan-Dec;16(1):2302310. doi: 10.1080/19490976.2024.2302310. Epub 2024 Jan 23. Gut Microbes. 2024. PMID: 38261437 Free PMC article.
-
Hyperfunction of post-synaptic density protein 95 promotes seizure response in early-stage aβ pathology.EMBO Rep. 2024 Mar;25(3):1233-1255. doi: 10.1038/s44319-024-00090-0. Epub 2024 Feb 27. EMBO Rep. 2024. PMID: 38413732 Free PMC article.
-
Oxytocin attenuates microglial activation and restores social and non-social memory in APP/PS1 Alzheimer model mice.iScience. 2023 Mar 31;26(4):106545. doi: 10.1016/j.isci.2023.106545. eCollection 2023 Apr 21. iScience. 2023. PMID: 37128547 Free PMC article.
References
-
- Jankowsky JL, Fadale DJ, Anderson J, Xu GM, Gonzales V, Jenkins NA, Copeland NG, Lee MK, Younkin LH, Wagner SL. et al.Mutant presenilins specifically elevate the levels of the 42 residue beta-amyloid peptide in vivo: evidence for augmentation of a 42-specific gamma secretase. Hum Mol Genet. 2004;14(2):159–170. - PubMed
-
- Sisodia SS, Price DL. Role of the beta-amyloid protein in Alzheimer's disease. FASEB journal: official publication of the Federation of American Societies for Experimental Biology. 1995;14(5):366–370. - PubMed
Publication types
MeSH terms
Substances
Grants and funding
LinkOut - more resources
Full Text Sources
Other Literature Sources
Medical
Molecular Biology Databases
