. 2013 Nov 25;3(1):78.
doi: 10.1186/2191-219X-3-78.

Kinetic analysis of [11C]befloxatone in the human brain, a selective radioligand to image monoamine oxidase A

Affiliations

Kinetic analysis of [11C]befloxatone in the human brain, a selective radioligand to image monoamine oxidase A

Paolo Zanotti-Fregonara et al. EJNMMI Res. .

Abstract

Background: [11C]Befloxatone measures the density of the enzyme monoamine oxidase A (MAO-A) in the brain. MAO-A is responsible for the degradation of different neurotransmitters and is implicated in several neurologic and psychiatric illnesses. This study sought to estimate the distribution volume (VT) values of [11C]befloxatone in humans using an arterial input function.

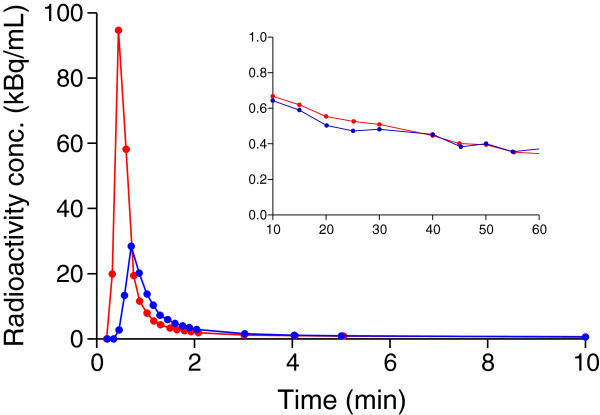
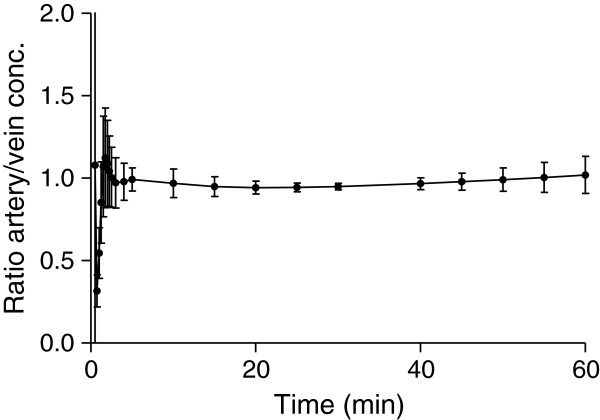
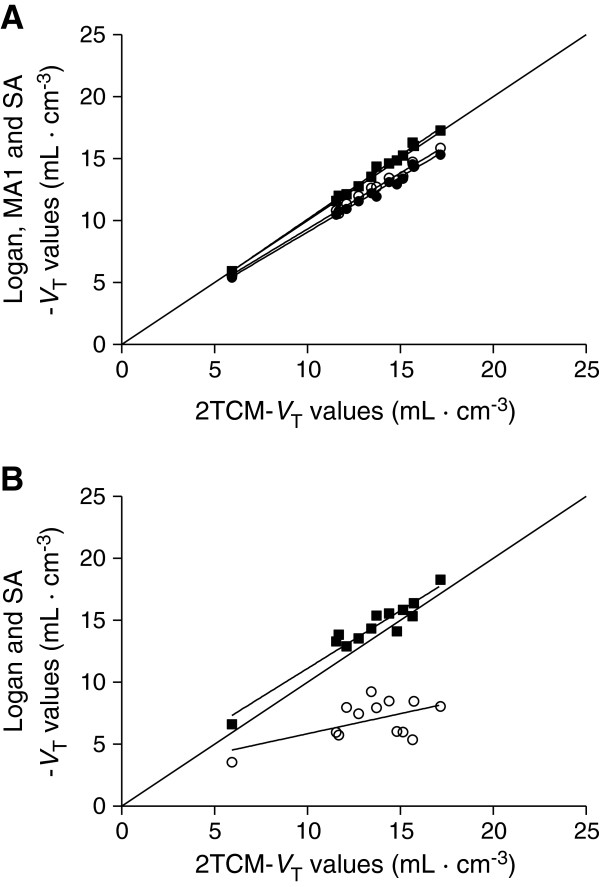
Methods: Seven healthy volunteers were imaged with positron emission tomography (PET) after [11C]befloxatone injection. Kinetic analysis was performed using an arterial input function in association with compartmental modeling and with the Logan plot, multilinear analysis (MA1), and standard spectral analysis (SA) at both the regional and voxel level. Arterialized venous samples were drawn as an alternative and less invasive input function.

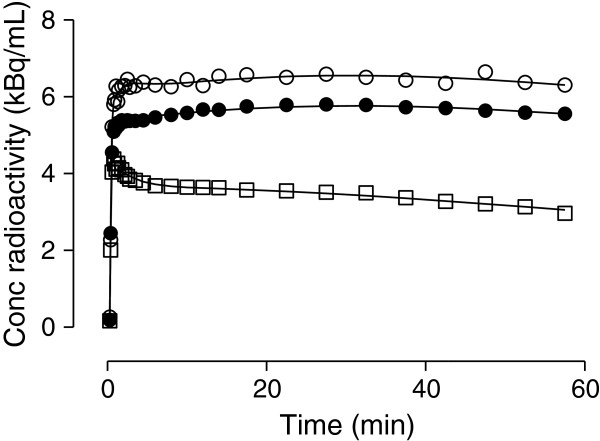
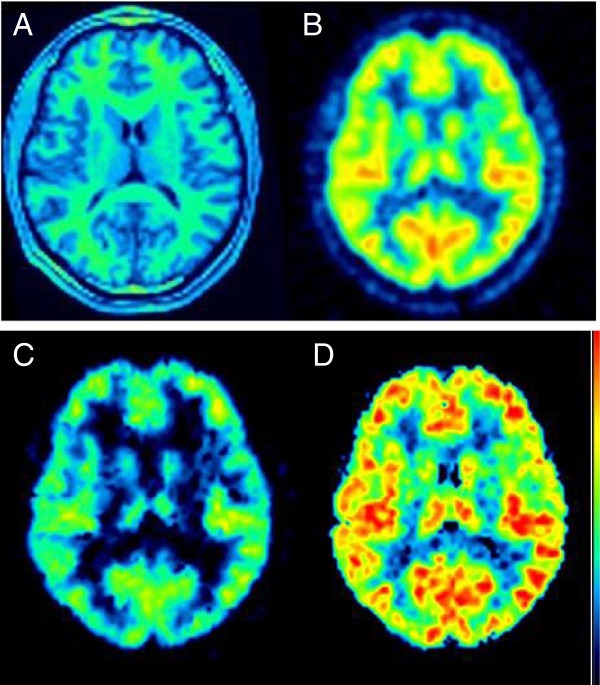
Results: An unconstrained two-compartment model reliably quantified VT values in large brain regions. A constrained model did not significantly improve VT identifiability. Similar VT results were obtained using SA; however, the Logan plot and MA1 slightly underestimated VT values (about -10%). At the voxel level, SA showed a very small bias (+2%) compared to compartmental modeling, Logan severely underestimated VT values, and voxel-wise images obtained with MA1 were too noisy to be reliably quantified. Arterialized venous blood samples did not provide a satisfactory alternative input function as the Logan-VT regional values were not comparable to those obtained with arterial sampling in all subjects.

Conclusions: Binding of [11C]befloxatone to MAO-A can be quantified using an arterial input function and a two-compartment model or, in parametric images, with SA.


Figures

Figure 1
Figure 1
Plasma time-activity curve of [11C]befloxatone concentrations in arterial and venous blood for a representative subject. The main frame shows the first 10 min; the inset magnifies the remaining part of the input function. Red curve, arterial blood; blue curve, venous blood. The venous peak was predictably much lower than the arterial one, but [11C]befloxatone concentrations were remarkably similar immediately after the peak until the end of the scan. Although compartmental modeling cannot be used with a venous input due to the different shapes of the early part of the curves, the Logan graphical analysis only depends on the total area under the curve. For this subject, the VT error using only the venous input was 7.2% compared to the reference VT values obtained with the arterial input.
Figure 2
Figure 2
Arteriovenous difference of radioligand concentrations (mean ± SD) across the different subjects. Equilibrium was reached within 3 min of injection and remained stable until the end of the scan.
Figure 3
Figure 3
Representative brain time-activity curves in one subject. Three regions are shown: putamen (empty circle), parietal cortex (filled circle), and cerebellum (empty square). Lines represent fitting with unconstrained 2TCM.
Figure 4
Figure 4
Brain images. MRI (A), summed PET (B), and VT parametric images in a representative subject. The parametric images were calculated with the Logan plot (C) and spectral analysis (D) and are shown with the same color scale. Parametric images obtained with MA1 (not shown) were too noisy to be quantified.
Figure 5
Figure 5
Regression analyses for VT results obtained from the 13 brain regions of a 23-year-old subject. (A) Spectral analysis (filled square) provided good results with a very small bias (+1.4%). Logan (empty circle) and MA1 (filled circle) slightly underestimated VT values (-7.4% and -9.7%, respectively, for this subject). At the voxel level (B), only SA provided results with a small bias and good correlation with 2TCM (0.932x + 1.793, R2 = 0.92, p < 0.0001). In contrast, Loganvoxel underestimated VT values by about 47% (0.324x + 2.61, R2 = 0.32, p = 0.047).

References

    1. Fowler JS, Volkow ND, Wang GJ, Pappas N, Logan J, MacGregor R, Alexoff D, Shea C, Schlyer D, Wolf AP, Warner D, Zezulkova I, Cilento R. Inhibition of monoamine oxidase B in the brains of smokers. Nature. 1996;379:733–736. doi: 10.1038/379733a0. - DOI - PubMed
    1. Lewis A, Miller JH, Lea RA. Monoamine oxidase and tobacco dependence. Neurotoxicology. 2007;28:182–195. doi: 10.1016/j.neuro.2006.05.019. - DOI - PubMed
    1. Duncan J, Johnson S, Ou XM. Monoamine oxidases in major depressive disorder and alcoholism. Drug Discov Ther. 2012;6:112–122. - PubMed
    1. Guillem K, Vouillac C, Azar MR, Parsons LH, Koob GF, Cador M, Stinus L. Monoamine oxidase inhibition dramatically increases the motivation to self-administer nicotine in rats. J Neurosci. 2005;25:8593–8600. doi: 10.1523/JNEUROSCI.2139-05.2005. - DOI - PMC - PubMed
    1. Villegier AS, Salomon L, Granon S, Changeux JP, Belluzzi JD, Leslie FM, Tassin JP. Monoamine oxidase inhibitors allow locomotor and rewarding responses to nicotine. Neuropsychopharmacology. 2006;31:1704–1713. doi: 10.1038/sj.npp.1300987. - DOI - PubMed

LinkOut - more resources