. 2013 Dec 17;85(24):11858-11865.
doi: 10.1021/ac4025413. Epub 2013 Dec 4.

Isotopic ratio outlier analysis global metabolomics of Caenorhabditis elegans

Affiliations

Isotopic ratio outlier analysis global metabolomics of Caenorhabditis elegans

Gregory S Stupp et al. Anal Chem. .

Abstract

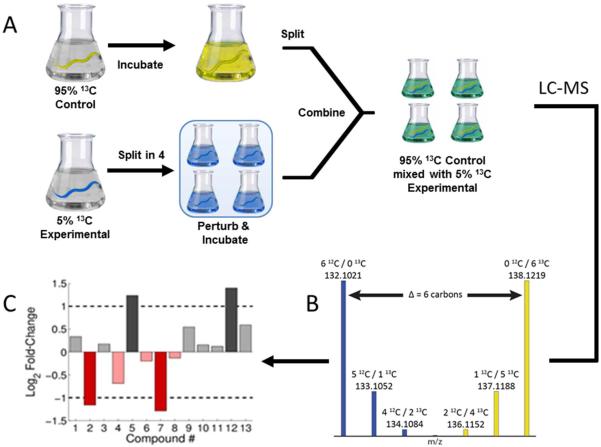
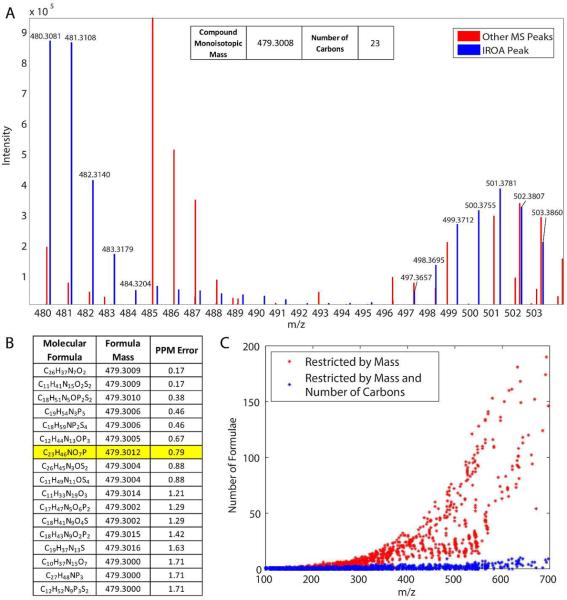
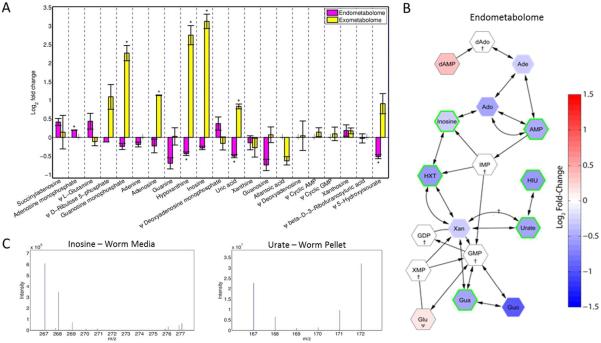
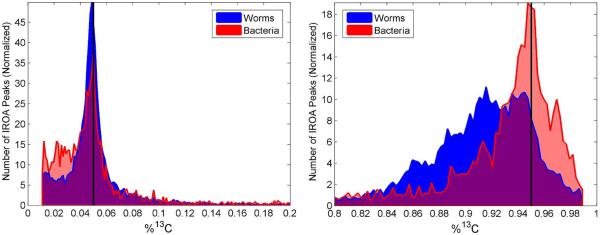
We demonstrate the global metabolic analysis of Caenorhabditis elegans stress responses using a mass-spectrometry-based technique called isotopic ratio outlier analysis (IROA). In an IROA protocol, control and experimental samples are isotopically labeled with 95 and 5% (13)C, and the two sample populations are mixed together for uniform extraction, sample preparation, and LC-MS analysis. This labeling strategy provides several advantages over conventional approaches: (1) compounds arising from biosynthesis are easily distinguished from artifacts, (2) errors from sample extraction and preparation are minimized because the control and experiment are combined into a single sample, (3) measurement of both the molecular weight and the exact number of carbon atoms in each molecule provides extremely accurate molecular formulas, and (4) relative concentrations of all metabolites are easily determined. A heat-shock perturbation was conducted on C. elegans to demonstrate this approach. We identified many compounds that significantly changed upon heat shock, including several from the purine metabolism pathway. The metabolomic response information by IROA may be interpreted in the context of a wealth of genetic and proteomic information available for C. elegans . Furthermore, the IROA protocol can be applied to any organism that can be isotopically labeled, making it a powerful new tool in a global metabolomics pipeline.


Figures

Figure 1
Figure 1. IROA Method
(A) Experimental and control groups of worms are isotopically labeled at 5% or 95% 13C and grown to young adult. The experimental group is split into 4 replicates and is perturbed, while the control group is not split. After incubation, the control group is split into 4 replicates, and each replicate is mixed 1:1 with an experimental replicate for uniform sample preparation and LC-MS analysis. (B) Biological compounds are easily distinguished from artifacts by the recognizable pattern caused by the isotopic enrichment. (C) Using automated software, the fold-changes for all detected biological compounds can be determined. The data in C are simulated.
Figure 2
Figure 2. IROA allows for the discrimination between biological molecules and artifacts and constrains the number of possible molecular formulae
(A) Representative mass spectrum from a single scan in the IROA experiment. The blue peaks indicate isotope peaks originating from a single biological compound, tentatively identified as the [M+H]+ of lysophosphatidylethanolamine 18:1. An [M+Na]+ peak was also observed helping to confirm the protonated form. Red peaks originate from background (noise) or other biological compounds. The fold-change of this compound can be quantified by determining the ratio between the sum of the intensities of the unlabeled 12C peak (480.3081) and its associated isotopic peaks (481.3108, 482.3140, etc…) to the sum of the intensities of the fully labeled 13C base peak (503.3860) and its associated isotopic peaks (502.3807, 501.3781, etc…). (B) A table detailing the possible molecular formulae for the monoisotopic mass of this compound. Of the 17 possible molecular formulae within 2 ppm mass error for the compound in (A), only one has the correct number of carbons, C23H46NO7P (highlighted). (C) The number of possible molecular formulae for a compound is greatly restricted when exact number of carbons is used as a constraint. The possible molecular formulae within 2 ppm for 3131 IROA peaks were generated with (blue) or without (red) constraining for the number of carbons. For both (B) and (C), the formulae were generated using HR2, allowing the elements C, H, N, O, P, and S and a mass error of up to 2 ppm. Formulae were filtered using the seven golden rules with the exception of the isotopic pattern filter.
Figure 3
Figure 3. IROA allows for the relative determination of changes in metabolites
(A) The fold-changes for 21 compounds in the KEGG Purine Metabolism pathway are shown for the endo- and exometabolomes. Values represent means (n ≥ 3) and the error bars are the standard deviation. A bar without upper or lower bounds (|) indicates that the compound was detected in less than 3 replicates and is therefore not included in the analysis. Bars with one asterisk (*) indicate significant changes (P<0.001). (B) A section of the human purine metabolism pathway from KEGG is shown as a network with metabolites as nodes and reactions as edges. Compounds included in this network were either detected in this experiment or are annotated as participating in a reaction with a detected compound. The nodes are colored according to the log2 fold-changes in the pellets of heat-shocked worms. Nodes marked with a dagger (†) were not found in this experiment. Nodes with a green border indicate that the fold changes were significant (P<0.001). All compounds, except those marked with a Psi (Ψ), were confirmed by MS-MS (Figures S-6 – S-16). Non-standard abbreviations: dAdo, deoxyadenosine; Ade, adenine; Ado, adenosine; HXT, hypoxanthine; HIU, 5-hydroxyisourate; Xan, xanthine; XMP, xanthosine 5'-phosphate; Gua, guanine; Guo, guanosine;. (C) An IROA peak for the [M-H] of inosine demonstrates an increase of the 5% 13C labeled sample relative to the 95% 13C labeled sample indicating an increase in inosine in the released exometabolome of heat-shocked worms relative to the control (left). An IROA peak for urate demonstrates a relative decrease in urate in the endometabolomes of heat-shocked worms (right).
Figure 4
Figure 4. Distribution of isotopic labels in IROA experiments
The histograms indicate the actual percent 13C incorporation for each IROA peak for the labeling of worms (blue) and bacteria (red) with 5% 13C glucose (left) and 95% 13C glucose (right). Black lines are drawn at 5% (left) and 95% (right).

References

    1. de Jong FA, Beecher C. Bioanalysis. 2012;4:2303–2314. - PMC - PubMed
    1. Lu W, Kwon YK, Rabinowitz JD. J. Am. Soc. Mass Spectrom. 2007;18:898–909. - PMC - PubMed
    1. Mashego MR, Wu L, Van Dam JC, Ras C, Vinke JL, Van Winden WA, Van Gulik WM, Heijnen JJ. Biotechnol. Bioeng. 2004;85:620–628. - PubMed
    1. Wu L, Mashego MR, van Dam JC, Proell AM, Vinke JL, Ras C, van Winden WA, van Gulik WM, Heijnen JJ. Anal. Biochem. 2005;336:164–171. - PubMed
    1. Bennett BD, Yuan J, Kimball EH, Rabinowitz JD. Nat. Protoc. 2008;3:1299–1311. - PMC - PubMed

Publication types