. 2014 Aug:143:24-32.
doi: 10.1016/j.ultramic.2013.10.015. Epub 2013 Nov 11.

Correlated cryo-fluorescence and cryo-electron microscopy with high spatial precision and improved sensitivity

Affiliations

Correlated cryo-fluorescence and cryo-electron microscopy with high spatial precision and improved sensitivity

Martin Schorb et al. Ultramicroscopy. 2014 Aug.

Abstract

Performing fluorescence microscopy and electron microscopy on the same sample allows fluorescent signals to be used to identify and locate features of interest for subsequent imaging by electron microscopy. To carry out such correlative microscopy on vitrified samples appropriate for structural cryo-electron microscopy it is necessary to perform fluorescence microscopy at liquid-nitrogen temperatures. Here we describe an adaptation of a cryo-light microscopy stage to permit use of high-numerical aperture objectives. This allows high-sensitivity and high-resolution fluorescence microscopy of vitrified samples. We describe and apply a correlative cryo-fluorescence and cryo-electron microscopy workflow together with a fiducial bead-based image correlation procedure. This procedure allows us to locate fluorescent bacteriophages in cryo-electron microscopy images with an accuracy on the order of 50 nm, based on their fluorescent signal. It will allow the user to precisely and unambiguously identify and locate objects and events for subsequent high-resolution structural study, based on fluorescent signals.

Keywords: Bacteriophage particles; Correlative light and electron microscopy (CLEM); Cryo-electron microscopy (cryo-EM); Cryo-fluorescence microscopy (cryo-FM); Fiducial beads; High-accuracy localization; Low-temperature fluorescence microscopy.


Figures

Fig. 1
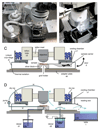
Fig. 1. The cryo-FM setup.
A Overview photograph of the cryo-FM setup. The Linkam cryo-stage is mounted onto an upright microscope. On top of the stage is the modified lid with its aluminium cooling chamber (c1) and the Teflon tube (c2) that surrounds the objective. The dewars containing LN (d1, d2) and the pump (p) are connected to the cryo-stage by tubes (t1-t4). The table on the right (t) allows the transfer box (Fig. 2) to slide and connect to the stage door (d). B Higher-magnification view of the cryo-stage (st) and lid. Cooling line t1 supplies LN from dewar d1 (not shown, see Fig. 1A) to the silver-block that supports the sample. The LN evaporates within the tube and leaves the chamber through t2 to the pump (Fig. 1A). This gas is vented via t4 to the back lens of the objective back to prevent condensation. Line t3 purges the chamber with dry gas. The adaptor plate connecting the stage to the microscope (ap), and the door to the stage (d) are marked. C Illustration of the cryo-FM system in cross-section. The grid sits in the grid holder that in turn sits on a silver block inside the stage chamber. The grid holder is moved with a sample carrier that is inserted through the door (d) on the side. The actual location of the EM grid (sample) is indicated in magenta. D Schematic depiction of cooling and purging flows in the cryo-stage. The dark blue colour indicates LN, light blue indicates dry nitrogen gas flows. The silver block that supports the sample is cooled by LN, that is transported through tubes t1 and t2 by a pump (p) and evaporates while in the tubes. The chamber is purged with cold nitrogen gas from a dewar (d2) with an incorporated electric heater. The resulting overpressure prevents humidity from entering. The objective back lens is flushed with dry gas (t4) to prevent condensation. The stage surfaces are cooled by dry ice in the cooling chamber of the lid (c1). The transfer box (Fig. 2B) is filled with LN and can be tightly attached to the stage. The sample carrier, while present during imaging, is not illustrated to improve clarity.
Fig. 2
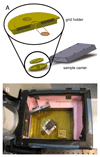
Fig. 2. The grid holder and transfer box.
A A schematic representation of the two-part holder for standard EM grids. The grid sits on the lower brass disc and is held in place by the weight of the upper brass disc whose thin cover allows imaging with a small working distance objective. The off-centre holes in the upper disc are to facilitate manipulation with tweezers. The grid holder fits into the Linkam sample carrier. B A photograph showing the transfer box, attached to the microscope, from above. The sample carrier sits in its loading station inside the transfer box. The brass well is filled with LN while in operation. The carrier is loaded into the cryo-stage via the door (d) and slides into the chamber. The door can be closed before the transfer box is removed for imaging. A brass block (b) holds the grid box during loading.
Fig. 3
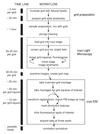
Fig. 3. The cryo-FM/EM work-flow and time schedule for plunge-frozen specimens.
The central column lists the individual steps in the workflow, with their estimated duration indicated in the left column. A continuous line indicates a single procedure, whereas a dashed line indicates positions where the procedure can be paused. Grey boxes indicate the key sessions of the experiment.
Fig. 4
Fig. 4. The high-accuracy correlation procedure
A Fluorescence image showing signals from multi-colour fluorescent beads and from green fluorescent bacteriophages within one EM grid square. Merge of red, green and blue channels. Towards the edges of the grid square, close to the copper bars of the grid, the thick ice and subsequent high concentration of fluorescent particles leads to a high background signal. B Magnified view of the region indicated in A. The signals from individual multi-colour fluorescent beads (Tetraspecks) that are used as fiducial marks are indicated by yellow circles. The signal from a feature of interest is indicated by a red square. C Intermediate-magnification cryo-EM map of the region shown in B. The field of view of panel B is marked by the dashed black lines. Corresponding fiducial beads are marked as in B (yellow circles). The red square is centred on the predicted coordinates of the feature of interest. Dark regions on the regular holey carbon support film (black arrows) are remnants of sucrose from particle purification. Red circles mark crystalline ice particles. D Magnified regions of C showing four typical fiducial beads (left panels) and four ice particles (right panels) as seen in the intermediate-magnification EM maps. The homogenous size and shape and distinct density of the fiducial markers allows them to be distinguished from ice particles. White arrows indicate 10 nm gold fiducial beads used to align the intermediate magnification maps to the high-magnification micrographs. Width of image windows: 400 nm. E High magnification cryo-EM image centred on the predicted position of the feature of interest, showing a p22 bacteriophage particle. The indicated circle revealing the predicted coordinates has a radius of 50 nm. White arrows indicate 10 nm gold particles.
Fig. 5
Fig. 5. Measurement of the accuracy of the correlation procedure.
A The predicted position of all beads (blue), and all bacteriophages (green), are marked relative to the true position of the bead or bacteriophage. The true position is the origin. For comparison, the outline of a bacteriophage is shown to scale (red hexagon), as is the outline of a single 139 nm pixel in the fluorescence image (red square). B The localization error is plotted against the percentage of correlations with errors smaller than that localization error. Blue curve: the deviation of the fiducial bead position in EM from their predicted position applying a leave-one-out cross-validation. Green curve: the deviation of the predicted position of the bacteriophage particles from their true position.

References

    1. Tsien RY. The green fluorescent protein. Annu Rev Biochem. 1998;67:509–544. - PubMed
    1. Giepmans BNG, Adams SR, Ellisman MH, Tsien RY. The fluorescent toolbox for assessing protein location and function. Science. 2006;312:217–224. - PubMed
    1. Betzig E, Patterson GH, Sougrat R, Lindwasser OW, Olenych S, Bonifacino JS, et al. Imaging intracellular fluorescent proteins at nanometer resolution. Science. 2006;313:1642–1645. - PubMed
    1. Klar TA, Jakobs S, Dyba M, Egner A, Hell SW. Fluorescence microscopy with diffraction resolution barrier broken by stimulated emission. Proc Natl Acad Sci U S A. 2000;97:8206–8210. - PMC - PubMed
    1. Karreman MA, Agronskaia AV, van Donselaar EG, Vocking K, Fereidouni F, Humbel BM, et al. Optimizing immuno-labeling for correlative fluorescence and electron microscopy on a single specimen. J Struct Biol. 2012;180:382–386. - PubMed

MeSH terms

Substances