. 2014 Feb;10(2):356-71.
doi: 10.4161/auto.26864. Epub 2013 Nov 21.

Characterization of early autophagy signaling by quantitative phosphoproteomics

Affiliations

Characterization of early autophagy signaling by quantitative phosphoproteomics

Kristoffer Tg Rigbolt et al. Autophagy. 2014 Feb.

Abstract

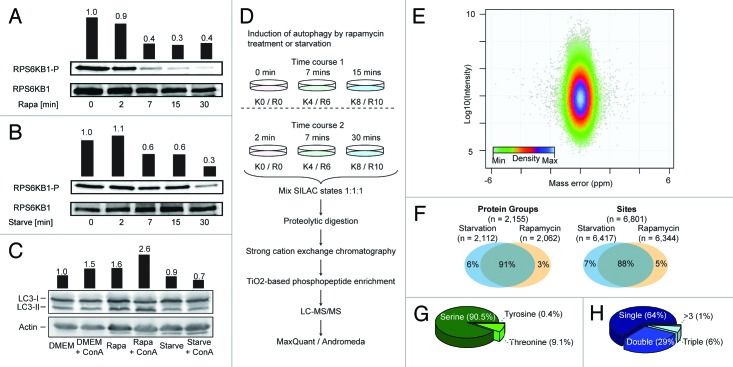
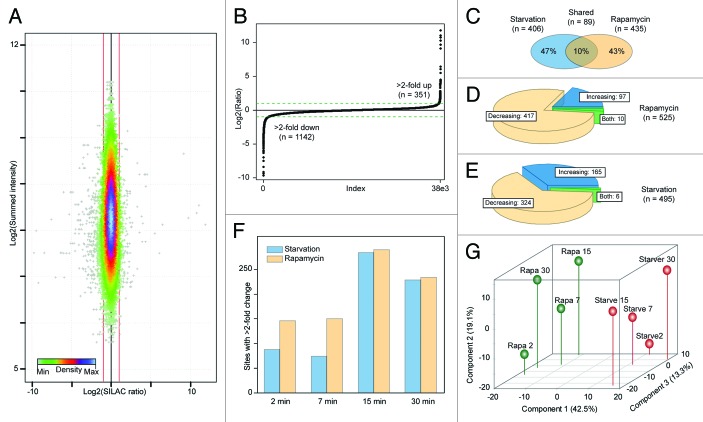
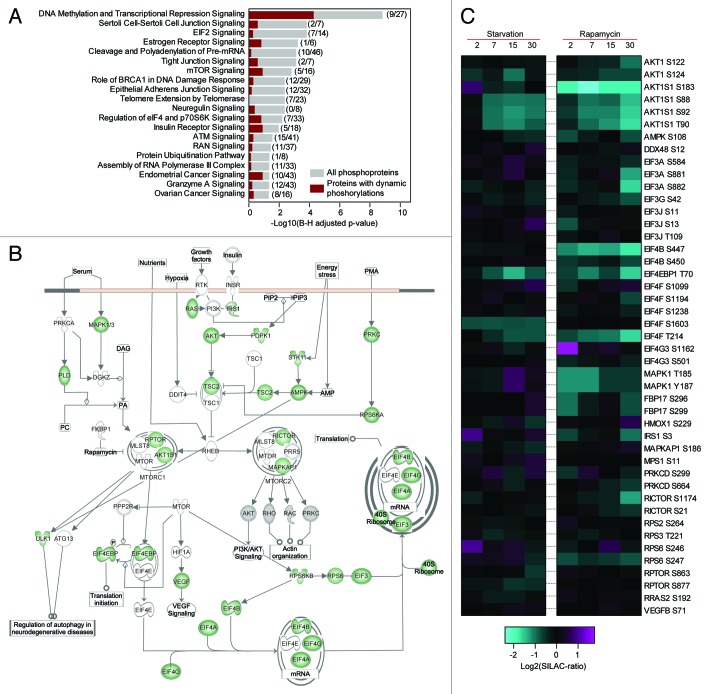
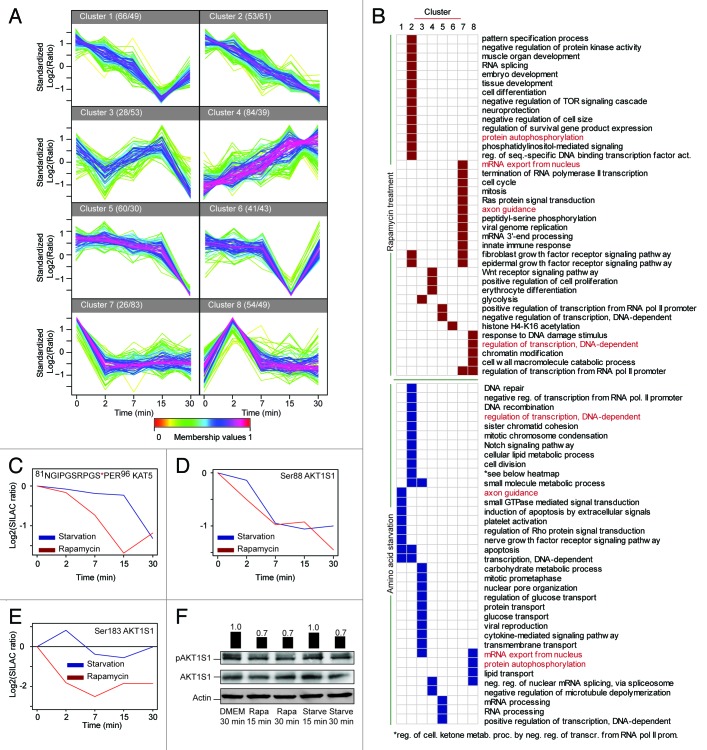
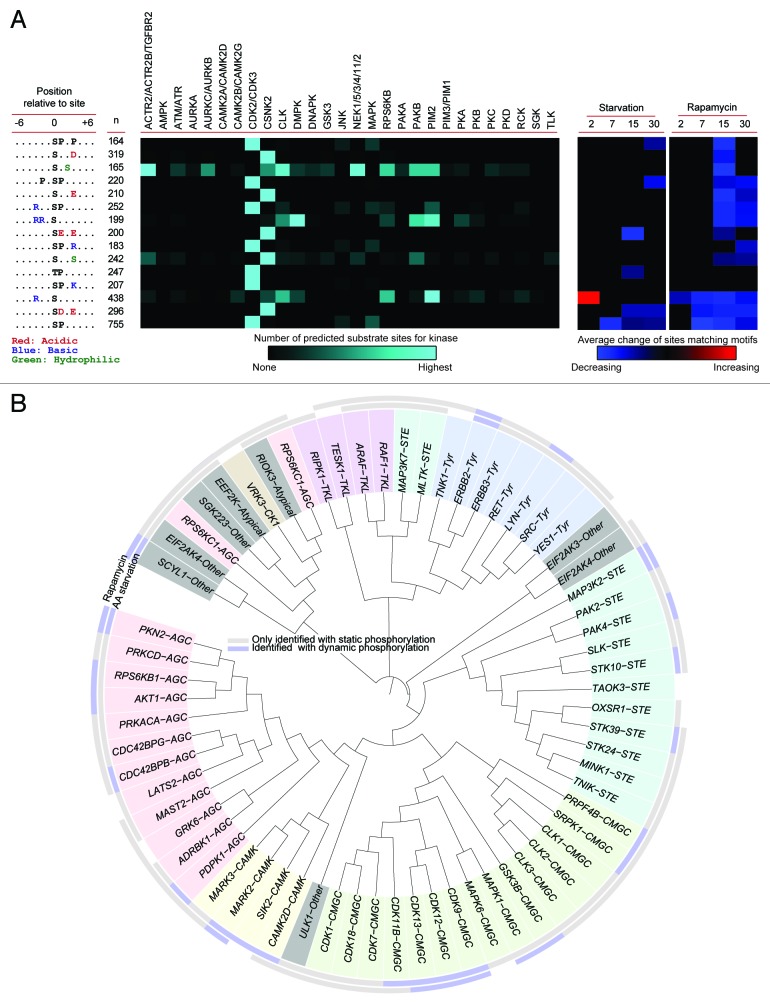
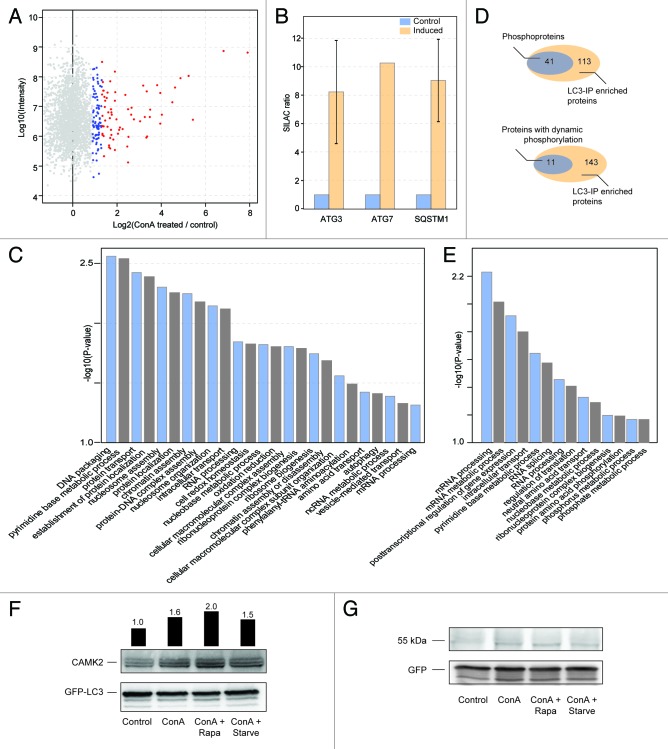
Under conditions of nutrient shortage autophagy is the primary cellular mechanism ensuring availability of substrates for continuous biosynthesis. Subjecting cells to starvation or rapamycin efficiently induces autophagy by inhibiting the MTOR signaling pathway triggering increased autophagic flux. To elucidate the regulation of early signaling events upon autophagy induction, we applied quantitative phosphoproteomics characterizing the temporal phosphorylation dynamics after starvation and rapamycin treatment. We obtained a comprehensive atlas of phosphorylation kinetics within the first 30 min upon induction of autophagy with both treatments affecting widely different cellular processes. The identification of dynamic phosphorylation already after 2 min demonstrates that the earliest events in autophagy signaling occur rapidly after induction. The data was subjected to extensive bioinformatics analysis revealing regulated phosphorylation sites on proteins involved in a wide range of cellular processes and an impact of the treatments on the kinome. To approach the potential function of the identified phosphorylation sites we performed a screen for MAP1LC3-interacting proteins and identified a group of binding partners exhibiting dynamic phosphorylation patterns. The data presented here provide a valuable resource on phosphorylation events underlying early autophagy induction.

Keywords: autophagy; bioinformatics; mass spectrometry; phosphoproteomics; phosphorylation; proteomics; signal transduction.


Figures

None
Figure 1. Characterization of the MCF7 phosphoproteome. (A) Levels of phosphorylation of Thr389 RPS6KB1 in response to rapamycin (Rapa) treatment and (B) starvation are shown. Bars indicate quantification of intensity normalized by total RPS6KB1 relative to the first lane. (C) Induction of autophagic flux analyzed by anti-GFP-LC3 blots. ConA was added to inhibit lysosomal degradation. Bars indicate LC3-II levels normalized to actin relative to the first lane. (D) Outline of experimental strategy for quantitative phosphoproteomics characterization of MCF7 cells upon induction of autophagy. Time courses 1 and 2 shared 7 min as common time point allowing the construction of 5 time points kinetics. (E) Mass error and intensity distribution of peptide identifications. (F) Overlap of identified phosphorylated protein groups and phosphorylation sites identified after starvation and rapamycin treatment. (G) Proportion of phosphorylated serine, threonine and tyrosine residues. (H) Distribution of single, double, and multiphosphorylated peptide identifications.
None
Figure 2. Temporal dynamics of identified protein phosphorylations. (A) Density scatter plot of phosphorylation site quantification ratios vs. intensities, red lines indicating 2-fold dynamics (± 1 on Log2-scale). (B) Distribution of quantification ratios, dotted lines indicate regulation cut-off (± 1 on Log2-scale). (C) Venn diagram of regulated phosphorylation site identifications after the 2 treatments. (D) Distribution of sites with increasing or decreasing ratios after rapamycin treatment, sites indicated as both show both an increase and a decrease during the time-course. (E) Same as (D) for starvation. (F) Overview of the number of ratios with above 2-fold dynamics observed in each time point after the treatments. (G) Principal component analysis of log2 transformed phosphorylation-site ratios. Points corresponding to rapamycin and starvation treatment are shown in green and red, respectively. The numbering of the points indicates the time in minutes of the treatment duration.
None
Figure 3. Pathway analysis of identified phosphorylation sites. (A) List of pathways from Ingenuity Pathway Analysis software found as enriched for the identified phosphoproteins, gray bars indicate P values for enrichment of all identified phosphoproteins and red bars for proteins with dynamically regulated phosphosites. Numbers in bracket indicate, first, the number of identified phosphoproteins with dynamic sites in the pathway and, second, all identified phosphoproteins in the pathway. Due to partial overlaps between pathways the same protein might occur in more than one pathway. (B) Graphical representation of the MTOR signaling pathway, proteins identified with phosphorylation are indicated in green. The connection between AMPK and ULK1 was added manually. (C) Dynamics of the sites identified on proteins in the MTOR signaling pathway shown in (B) for which quantification values in all time-points were obtained.
None
Figure 4. Clustering and gene ontology enrichment analysis. (A) For cluster analysis ratios for sites with quantifications in all time-points were log2 transformed and standardized (z-scored) and submitted to clustering by fuzzy c-means. Numbers after cluster label indicate the number of sites after starvation (first) and rapamycin (second). (B) The phosphorylation sites found in each cluster in (A) were tested against the sites showing no dynamics for enrichment of GO biological process terms using Fisher’s exact test. The maps indicate the significantly enriched (P value < 0.05 after B-H correction) GO terms in the respective cluster(s) by rapamycin treatment (top, red) and starvation (bottom, blue). GO terms written in red represent terms that are found enriched after both treatments. Temporal profiles of (C) Ser90 of KAT5, (D) Ser88 of AKT1S1, and (E) Ser183 of AKT1S1. (F) Western blot of Ser183 on AKT1S1, bars indicate quantifications normalized to actin relative to the control (DMEM 30 min).
None
Figure 5. Kinome and kinase-motif analysis. (A) Linear kinase motifs present in the data were extracted using Motif-X (left panel) and predictions for kinase groups phosphorylating the sites matching the motifs were obtained from the NetworKIN algorithm (middle panel). See Table S6 for individual kinase(s) most likely responsible for phosphorylation of respective motifs. The means of the regulated sites matching each motif were tested for difference from zero. If significant (P value < 0.05) the mean value is indicated in the right panel, with red indicating increasing and blue indicating decreasing phosphorylation levels. (B) All identified kinases were aligned and presented according to the homology of the kinase domains. Protein kinases belonging to the same family are colored in the same background color. The rims indicate if static, nonchanging sites (gray), or dynamic sites (blue) are identified on the respective kinase by starvation (inner rim), or rapamycin treatment (outer rim).
None
Figure 6. Large-scale screen for phosphorylated LC3 interaction partners. (A) Using a rat eGFP-MAP1LC3-MCF7 cell line immunoprecipitations by anti-GFP antibodies were performed to enrich LC3-interacting proteins from untreated control cells and cells where autophagosomal degradation was blocked by the addition of 2 nM conA. From this analysis specific interactors could be identified as proteins exhibiting high ratios. Using the significance values provided by the MaxQuant software package significant interacting proteins were filtered (blue and red, P value below 0.05 and 0.01, respectively). (B) Enrichment ratios for the known LC3-interacting proteins ATG3, ATG7, and SQSTM1 are shown, error bars indicate standard error of 2 biological replicates. (C) Enriched GO terms for the identified LC3-interacting proteins were obtained from the DAVID resource using default parameters. (D) Venn diagram of overlap between identified LC3-interacting proteins and all proteins which we identified as phosphorylated in this study (top) and the subset of the phosphoproteins identified which have one or more dynamic phosphorylation (bottom). (E) Same as (C) for the 43 proteins overlapping between phosphorylation and LC3-interaction screens. (F) CAMK2-LC3 interaction. Cells were left untreated or treated for 30 min as indicated. GFP-LC3 and interacting proteins were precipitated and blotted using a pan-CAMK2 antibody as readout. Accumulation of CAMK2 isoforms can be observed by a block of autophagy using conA. Bars indicate CAMK2 band intensities normalized to GFP-LC3 relative to the first lane. (G) Experiment performed as under (F) except for using GFP-only cells. GFP is shown as loading control.

References

    1. Rabinowitz JD, White E. . Autophagy and metabolism. Science 2010; 330:1344 - 8; http://dx.doi.org/10.1126/science.1193497; PMID: 21127245 - DOI - PMC - PubMed
    1. De Duve C, Wattiaux R. . Functions of lysosomes. Annu Rev Physiol 1966; 28:435 - 92; http://dx.doi.org/10.1146/annurev.ph.28.030166.002251; PMID: 5322983 - DOI - PubMed
    1. Klionsky DJ. . Autophagy: from phenomenology to molecular understanding in less than a decade. Nat Rev Mol Cell Biol 2007; 8:931 - 7; http://dx.doi.org/10.1038/nrm2245; PMID: 17712358 - DOI - PubMed
    1. He C, Klionsky DJ. . Regulation mechanisms and signaling pathways of autophagy. Annu Rev Genet 2009; 43:67 - 93; http://dx.doi.org/10.1146/annurev-genet-102808-114910; PMID: 19653858 - DOI - PMC - PubMed
    1. Johansen T, Lamark T. . Selective autophagy mediated by autophagic adapter proteins. Autophagy 2011; 7:279 - 96; http://dx.doi.org/10.4161/auto.7.3.14487; PMID: 21189453 - DOI - PMC - PubMed

Publication types