. 2014 Feb;137(Pt 2):323-34.
doi: 10.1093/brain/awt321. Epub 2013 Nov 25.

Disease progression in patients with single, large-scale mitochondrial DNA deletions

Affiliations

Disease progression in patients with single, large-scale mitochondrial DNA deletions

John P Grady et al. Brain. 2014 Feb.

Abstract

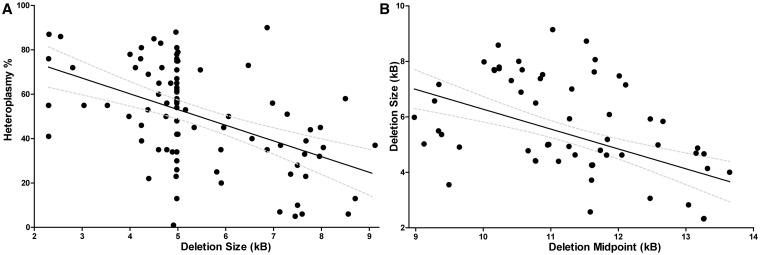
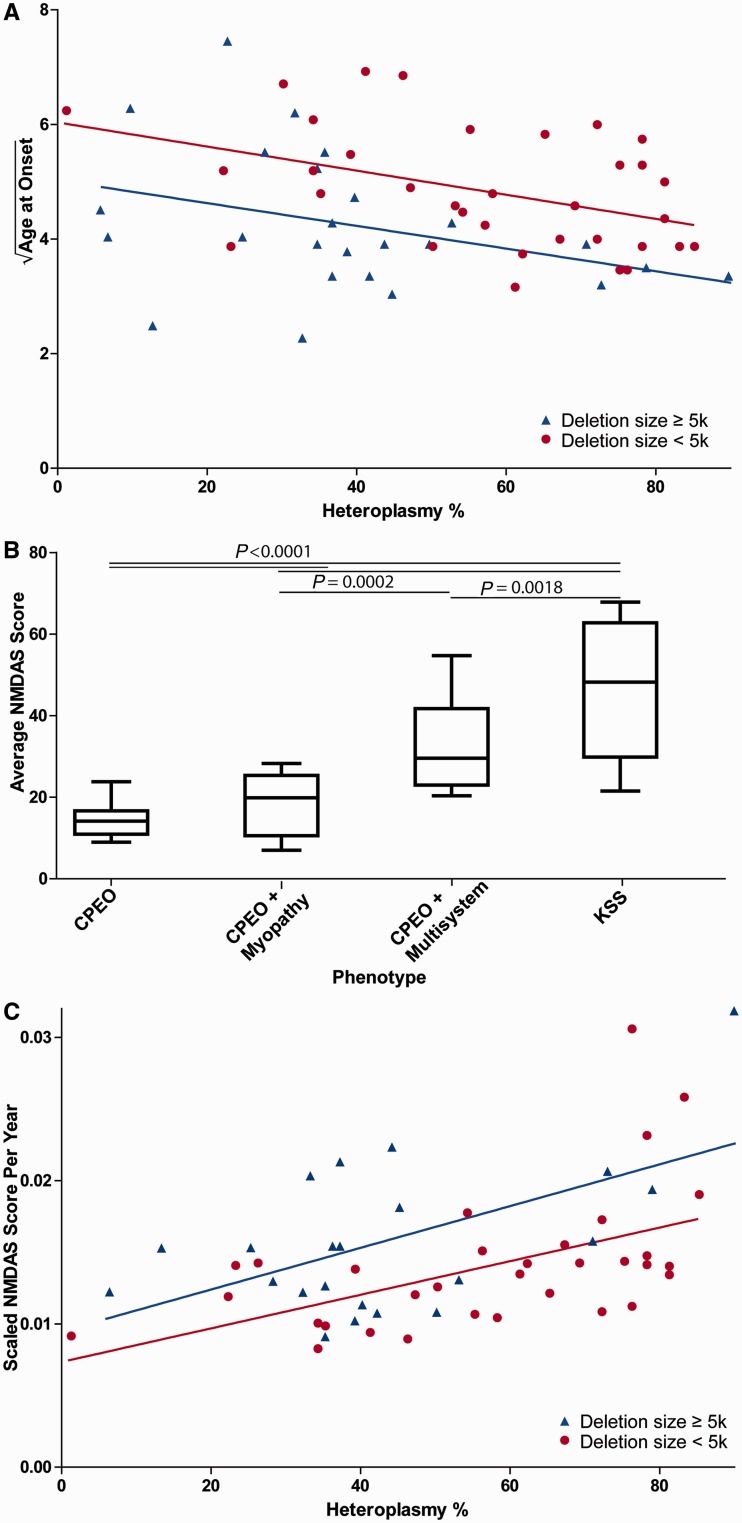
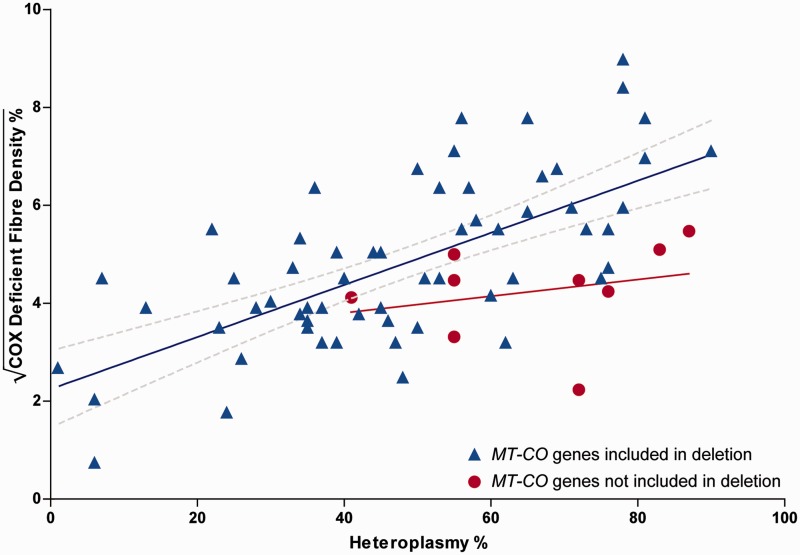
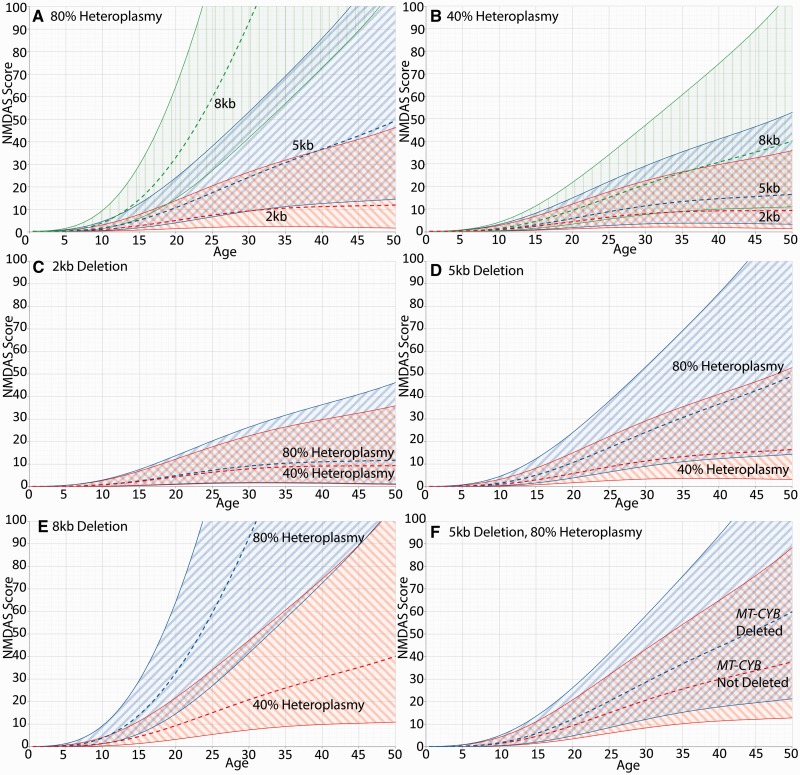
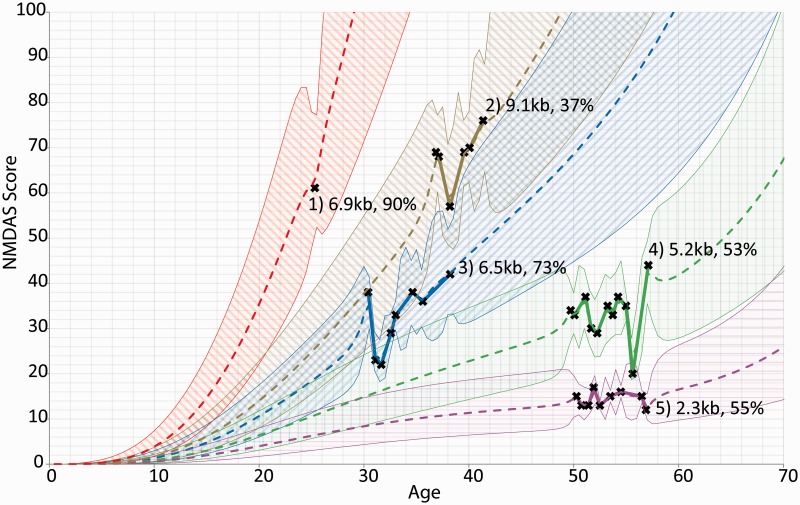
Single, large-scale deletions of mitochondrial DNA are a common cause of mitochondrial disease and cause a broad phenotypic spectrum ranging from mild myopathy to devastating multi-system syndromes such as Kearns-Sayre syndrome. Studies to date have been inconsistent on the value of putative predictors of clinical phenotype and disease progression such as mutation load and the size or location of the deletion. Using a cohort of 87 patients with single, large-scale mitochondrial DNA deletions we demonstrate that a variety of outcome measures such as COX-deficient fibre density, age-at-onset of symptoms and progression of disease burden, as measured by the Newcastle Mitochondrial Disease Adult Scale, are significantly (P < 0.05) correlated with the size of the deletion, the deletion heteroplasmy level in skeletal muscle, and the location of the deletion within the genome. We validate these findings with re-analysis of 256 cases from published data and clarify the previously conflicting information of the value of these predictors, identifying that multiple regression analysis is necessary to understand the effect of these interrelated predictors. Furthermore, we have used mixed modelling techniques to model the progression of disease according to these predictors, allowing a better understanding of the progression over time of this strikingly variable disease. In this way we have developed a new paradigm in clinical mitochondrial disease assessment and management that sidesteps the perennial difficulty of ascribing a discrete clinical phenotype to a broad multi-dimensional and progressive spectrum of disease, establishing a framework to allow better understanding of disease progression.

Keywords: disease progression; mitochondrial DNA deletion; mitochondrial diseases.


Figures

Figure 1
Figure 1
Putative predictors of disease progression are intercorrelated. (A) Skeletal muscle heteroplasmy is negatively correlated with mitochondrial DNA deletion size in our cohort. n = 87, r = −0.49, P < 0.0001. 95% CI is shown. The dense cluster of points around 5.0kb represents the cohort of patients with the common 4977 bp mitochondrial DNA deletion. (B) Mitochondrial DNA deletion size is negatively correlated with the location of the mitochondrial DNA deletion midpoint in our cohort. n = 83, r = −0.48, P < 0.0001. 95% CI is shown.
Figure 2
Figure 2
Heteroplasmy and deletion size are linearly correlated with age at onset and NMDAS score progression. (A) Age at onset is predicted by both mitochondrial DNA heteroplasmy and deletion size. The y-axis shows the square root of age at onset. Data are from our cohort (n = 60, R2 = 0.18). Both mitochondrial DNA heteroplasmy (P = 0.0027) and deletion size (P = 0.0039) are significantly correlated with age at onset in our cohort using multiple regression. P-values are for both predictors as continuous variables, mitochondrial DNA deletion size is dichotomous for visualization only. (B) Phenotype and average NMDAS score are highly significantly correlated (P < 0.0001). Individual comparison P-values are shown. (C) NMDAS progression (scaled NMDAS points per year) is highly significantly correlated with both mitochondrial DNA deletion size (P < 0.0001) and heteroplasmy (P < 0.0001) (n = 55, R2 = 0.49). The y-axis shows scaled NMDAS score per year. P-values are for both predictors as continuous variables, deletion size is dichotomous for visualization only. KSS = Kearns-Sayre syndrome.
Figure 3
Figure 3
COX-deficient fibre density is dependent on skeletal muscle mitochondrial DNA heteroplasmy and deletion of MT-CO genes. The y-axis shows the square root of the COX-deficient fibre density %. Data are from our cohort, n = 72, R2 = 0.43. Heteroplasmy (P < 0.0001) and deletion of MT-CO genes (P = 0.0018) are both significant predictors. Separate regression lines are shown for those that delete one or more MT-CO genes (n = 63, 95% CI for regression line shown) and those that do not (n = 9, gradient of regression line is not significantly non-zero, CI not shown).
Figure 4
Figure 4
The effect of mitochondrial DNA deletion size and heteroplasmy on NMDAS progression. All panels show 95% CI. (A and B) The effect of mitochondrial DNA deletion size at 80% and 40% heteroplasmy, respectively. Deletion size is shown to have a greater impact at high heteroplasmy than at low heteroplasmy. (C–E) The effect of mitochondrial DNA heteroplasmy for a 2.0 kb, 5.0 kb and 8.0 kb mitochondrial DNA deletion, respectively. For small deletions the effect of heteroplasmy on NMDAS progression is negligible, but for larger deletions the effect is substantial. (F) The effect of deletion location for a 5.0 kb deletion present at 80% heteroplasmy; progression is faster when MT-CYB is included in the deleted region. A–E are generated from a model using time, deletion size and heteroplasmy as predictors. The model used for F has an additional deletion location predictor (MT-CYB gene inclusion).
Figure 5
Figure 5
Longitudinal modelling of five individual patients with single, large-scale mitochondrial DNA deletion disease. The chosen patients are representative of the range of rates of disease progression found in our cohort. Actual NMDAS assessment scores are depicted as crosses joined by solid lines. Each patient is shown with their predicted progression trendline with 95% prediction intervals, and is labelled with deletion size and heteroplasmy. Only Patient 2 includes part of the MT-CYB gene in their deletion.

References

    1. Akaike H. A new look at the statistical model identification. IEEE Trans Automat Contr. 1974;AC-19:716–23.
    1. Apabhai S, Gorman GS, Sutton L, Elson JL, Plötz T, Turnbull DM, et al. Habitual physical activity in mitochondrial disease. PLoS One. 2011;6:e22294. - PMC - PubMed
    1. Auré K, Ogier de Baulny H, Laforêt P, Jardel C, Eymard B, Lombès A. Chronic progressive ophthalmoplegia with large-scale mtDNA rearrangement: can we predict progression? Brain. 2007;130:1516–24. - PubMed
    1. Bates MG, Hollingsworth KG, Newman JH, Jakovljevic DG, Blamire AM, MacGowan GA, et al. Concentric hypertrophic remodelling and subendocardial dysfunction in mitochondrial DNA point mutation carriers. Eur Heart J Cardiovasc Imaging. 2013;14:650–8. - PMC - PubMed
    1. Blackwood JK, Whittaker RG, Blakely EL, Alston CL, Turnbull DM, Taylor RW. The investigation and diagnosis of pathogenic mitochondrial DNA mutations in human urothelial cells. Biochem Biophys Res Commun. 2010;393:740–5. - PubMed

Publication types

Substances