. 2014 Jan 7;111(1):E139-48.
doi: 10.1073/pnas.1317377110. Epub 2013 Nov 25.

Microbial biogeography of wine grapes is conditioned by cultivar, vintage, and climate

Affiliations

Microbial biogeography of wine grapes is conditioned by cultivar, vintage, and climate

Nicholas A Bokulich et al. Proc Natl Acad Sci U S A. .

Abstract

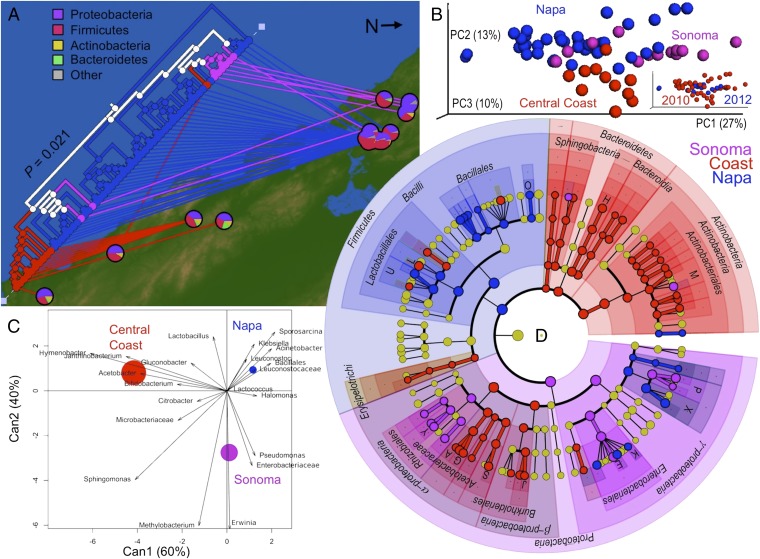
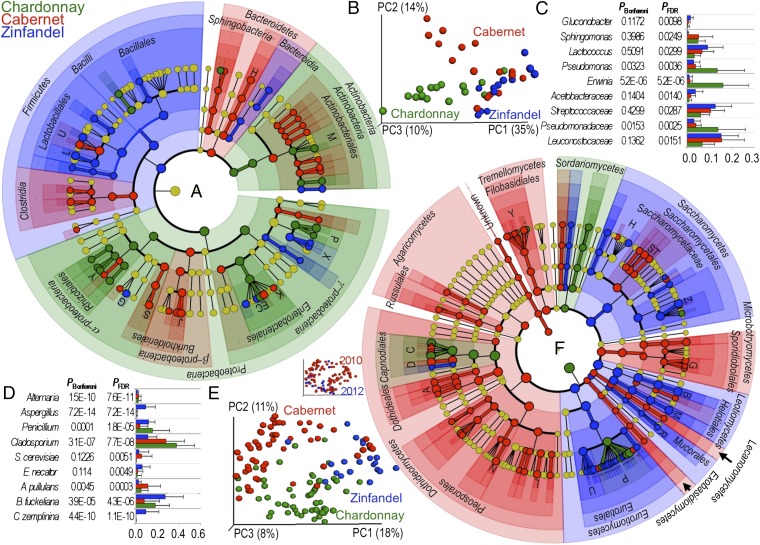
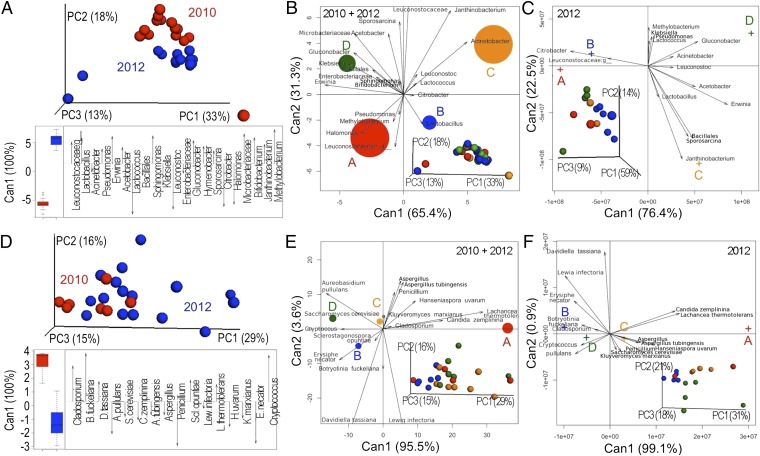
Wine grapes present a unique biogeography model, wherein microbial biodiversity patterns across viticultural zones not only answer questions of dispersal and community maintenance, they are also an inherent component of the quality, consumer acceptance, and economic appreciation of a culturally important food product. On their journey from the vineyard to the wine bottle, grapes are transformed to wine through microbial activity, with indisputable consequences for wine quality parameters. Wine grapes harbor a wide range of microbes originating from the surrounding environment, many of which are recognized for their role in grapevine health and wine quality. However, determinants of regional wine characteristics have not been identified, but are frequently assumed to stem from viticultural or geological factors alone. This study used a high-throughput, short-amplicon sequencing approach to demonstrate that regional, site-specific, and grape-variety factors shape the fungal and bacterial consortia inhabiting wine-grape surfaces. Furthermore, these microbial assemblages are correlated to specific climatic features, suggesting a link between vineyard environmental conditions and microbial inhabitation patterns. Taken together, these factors shape the unique microbial inputs to regional wine fermentations, posing the existence of nonrandom "microbial terroir" as a determining factor in regional variation among wine grapes.

Keywords: agriculture; metagenomics; next-generation sequencing; viticulture.


Conflict of interest statement

Conflict of interest statement: N.A.B., P.M.R., and D.A.M. all own shares of MicroTrek, Inc. a service laboratory serving the food and beverage industry.

Figures

Fig. 1.
Fig. 1.
Grape must bacterial communities demonstrate distinct regional patterns. (A) Weighted UniFrac distance dendrogram comparing bacterial communities of Chardonnay musts from across California. Branches are colored by the growing regions they represent, white branches encompass two or more regions. Pie charts represent average phylum-level taxonomic compositions of all samples from each site. P value represents goodness-of-fit scores between tree topology and sample ordination along the geographical axis. Map adapted from Oak Ridge National Lab Distributed Active Archive Center for Biogeochemical Dynamics spatial data access tool (http://webmap.ornl.gov/). (B) Weighted UniFrac distance PCoA of bacterial communities in Chardonnay musts from across California. (Inset) Same plot categorized by vintage. (C) Canonical discriminant analysis plot comparing Chardonnay musts from Napa, Sonoma, and Central Coast growing regions coplotted against bacterial taxa loadings. Circles represent canonical group means and 95% confidence interval for each class, which are significantly different if their confidence intervals do not overlap. Arrows represent the degree of correlation between each taxon and each class as a measure of predictive discrimination of each class. (D) LDA effect size taxonomic cladogram comparing all Chardonnay musts categorized by growing region. Significantly discriminant taxon nodes are colored and branch areas are shaded according to the highest-ranked variety for that taxon. For each taxon detected, the corresponding node in the taxonomic cladogram is colored according to the highest-ranked group for that taxon. If the taxon is not significantly differentially represented between sample groups, the corresponding node is colored yellow. Highly abundant and select taxa are indicated: A, Acetobacter; E, Erwinia; G, Gluconobacter; H, Hymenobacter; J, Janthinobacterium; K, Klebsiella; L, Lactobacillus; M, Microbacteriaceae; O, Sporosarcina; P, Pseudomonadaceae; S, Sphingomonas; U, Leuconostocaceae; X, Moraxellaceae; Y, Methylobacterium. For the complete list of discriminate taxa and ranks used to generate this cladogram, see Dataset S4.
Fig. 2.
Fig. 2.
Varietal variation in bacterial (Left) and fungal (Right) communities of Zinfandel, Cabernet Sauvignon, and Chardonnay grape musts. (A) LDA effect size taxonomic cladogram comparing bacterial communities in all Sonoma Cabernet Sauvignon, Chardonnay, and Zinfandel musts. Significantly discriminant taxon nodes are colored and branch areas are shaded according to the highest-ranked variety for that taxon. For each taxon detected, the corresponding node in the taxonomic cladogram is colored according to the highest-ranked group for that taxon. If the taxon is not significantly differentially represented between sample groups, the corresponding node is colored yellow. Highly abundant and select taxa are indicated: C, Citrobacter; E, Erwinia; G, Gluconobacter; H, Hymenobacter; J, Janthinobacterium; K, Klebsiella; L, Lactococcus; M, Microbacteriaceae; P, Pseudomonadaceae; S, Sphingomonas; U, Leuconostocaceae; X, Moraxellaceae; Y, Methylobacterium. (B) Weighted UniFrac distance PCoA of bacterial communities in all Sonoma Cabernet Sauvignon, Chardonnay, and Zinfandel musts. (C and D) One-way ANOVA of select bacterial (C) and fungal taxa (D) exhibiting significant differences between grape varieties. The x axes represent relative abundance (maximum 1.0). Bonferroni-corrected and false-discovery-rate (FDR) corrected P values are shown. (E) Bray–Curtis dissimilarity PCoA of fungal communities in all Cabernet Sauvignon, Chardonnay, and Zinfandel musts. (Inset) Same plot categorized by vintage. The x axis represents relative abundance (maximum 1.0). (F) LDA effect size taxonomic cladogram comparing fungal communities in all Cabernet Sauvignon, Chardonnay, and Zinfandel musts in all regions. Significantly discriminant taxon nodes are colored and branch areas are shaded according to the highest-ranked variety for that taxon. Highly abundant and select taxa are indicated: A, Aureobasidium pullulans; B, Botryotinia fuckeliana; C, Cladosporium; D, Davidiella; G, Rhodotorula glutinis; H, Hanseniaspora; M, Erysiphe necator; N, Sclerostagonospora opuntiae; P, Penicillium; R, Rhizopus oryzae; S, Saccharomyces cerevisiae; T, Lachancea thermotolerans; U, Aspergillus; Y, Cryptococcus; Z, Candida zemplinina. For the complete list of discriminate taxa and ranks used to generate these cladograms, see Datasets S7 and S8.
Fig. 3.
Fig. 3.
Correlation loading plots demonstrate environmental influence on select microbial populations within Chardonnay musts across California. Partial least squares regression correlation loadings of 15 environmental variables (gray text) and select microbial taxa (black text). (A) Selected bacterial populations (n = 18 variables) of all Chardonnay musts. (B) Selected fungal populations (n = 12 variables) of all Chardonnay musts.
Fig. 4.
Fig. 4.
Vintage affects vineyard-specific microbial patterns. Bacterial (Upper) and fungal (Lower) communities of Chardonnay musts from four Napa vineyards across 2 y. (A) Bacterial weighted UniFrac PCoA (Upper) and canonical discriminant analysis (Lower) comparing 2010 and 2012 vintages across all vineyards reveal strong vintage effects. (B and C) CDA plots comparing bacterial communities in musts from four separate vineyards in both vintages (B) and in 2012 only (C). (Insets) Weighted UniFrac PCoA comparison of the complete must bacterial communities in the corresponding vintage(s). (D) Fungal Bray–Curtis PCoA (Upper) and canonical discriminant analysis (Lower) comparing 2010 and 2012 vintages across all vineyards reveal strong vintage effects. (E and F) CDA plots comparing fungal communities in musts from four separate vineyards in both vintages (E) and in 2012 only (F). (Insets) Bray–Curtis PCoA comparison of the complete must fungal communities in the corresponding vintage(s). CDA circles represent canonical group means and 95% confidence interval for each class, which are significantly different if their confidence intervals do not overlap. Arrows represent the degree of correlation between each taxon and each class as a measure of predictive discrimination of each class.

Comment in

  • Microbial terroir for wine grapes.
    Gilbert JA, van der Lelie D, Zarraonaindia I. Gilbert JA, et al. Proc Natl Acad Sci U S A. 2014 Jan 7;111(1):5-6. doi: 10.1073/pnas.1320471110. Epub 2013 Dec 5. Proc Natl Acad Sci U S A. 2014. PMID: 24309378 Free PMC article. No abstract available.

References

    1. Martiny JB, et al. Microbial biogeography: Putting microorganisms on the map. Nat Rev Microbiol. 2006;4(2):102–112. - PubMed
    1. Koren O, et al. Host remodeling of the gut microbiome and metabolic changes during pregnancy. Cell. 2012;150(3):470–480. - PMC - PubMed
    1. Gibbons SM, et al. Evidence for a persistent microbial seed bank throughout the global ocean. Proc Natl Acad Sci USA. 2013;110(12):4651–4655. - PMC - PubMed
    1. Adams RI, Miletto M, Taylor JW, Bruns TD. Dispersal in microbes: Fungi in indoor air are dominated by outdoor air and show dispersal limitation at short distances. ISME J. 2013;7(7):1262–1273. - PMC - PubMed
    1. Peiffer JA, et al. Diversity and heritability of the maize rhizosphere microbiome under field conditions. Proc Natl Acad Sci USA. 2013;110(16):6548–6553. - PMC - PubMed

Publication types