. 2013 Dec 17;110(51):20364-71.
doi: 10.1073/pnas.1319661110. Epub 2013 Nov 25.

Autosis is a Na+,K+-ATPase-regulated form of cell death triggered by autophagy-inducing peptides, starvation, and hypoxia-ischemia

Affiliations

Autosis is a Na+,K+-ATPase-regulated form of cell death triggered by autophagy-inducing peptides, starvation, and hypoxia-ischemia

Yang Liu et al. Proc Natl Acad Sci U S A. .

Abstract

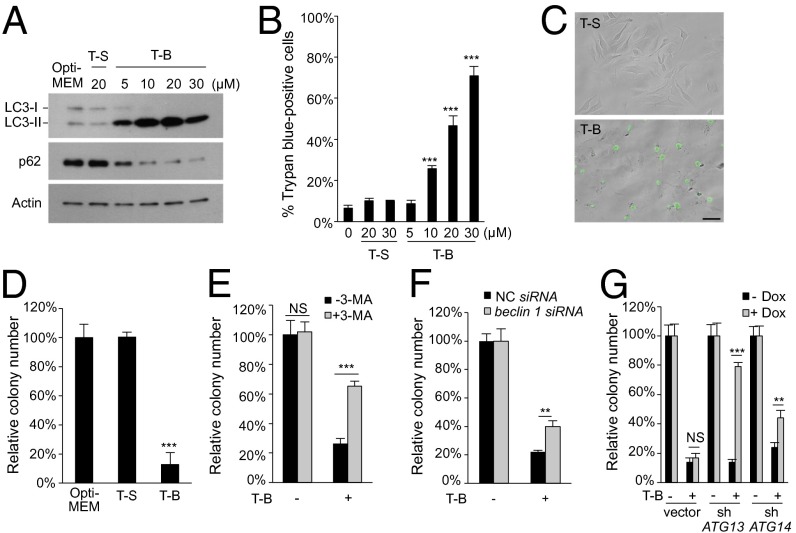
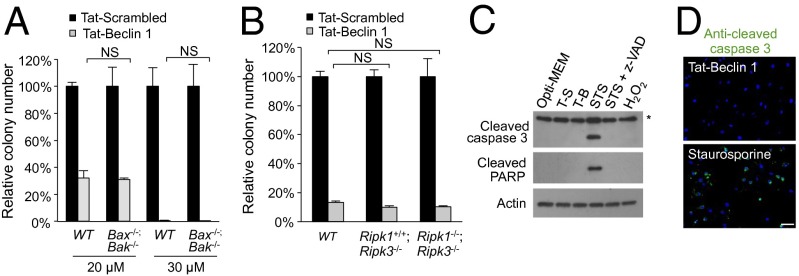
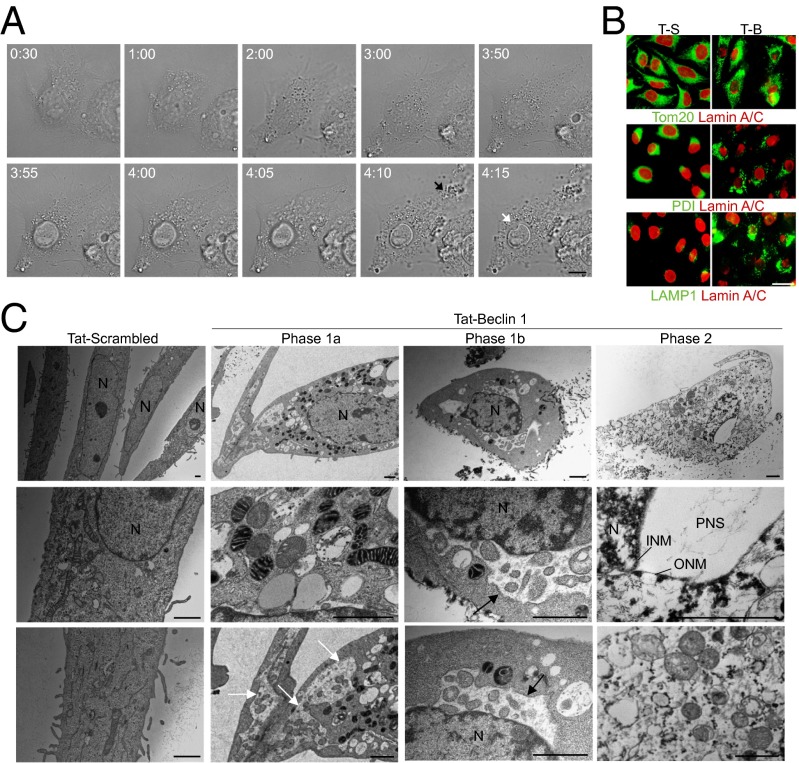
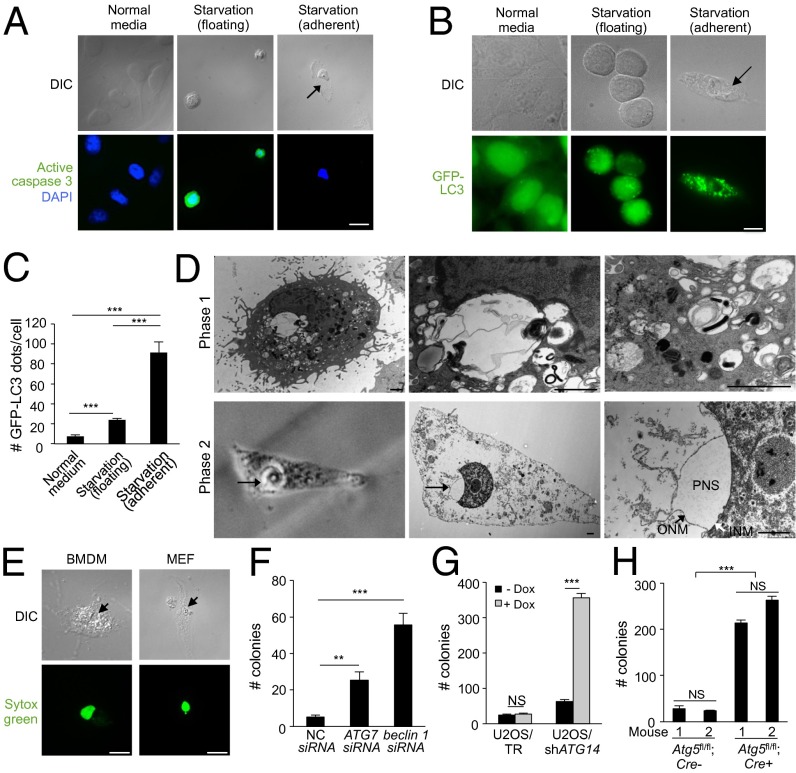
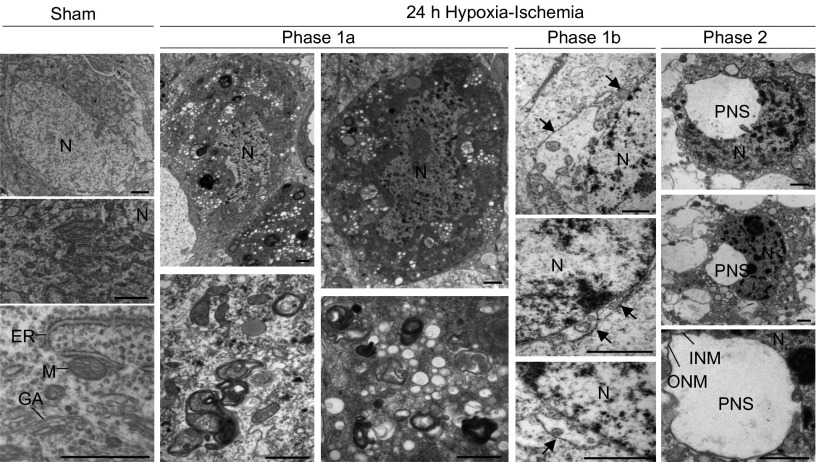
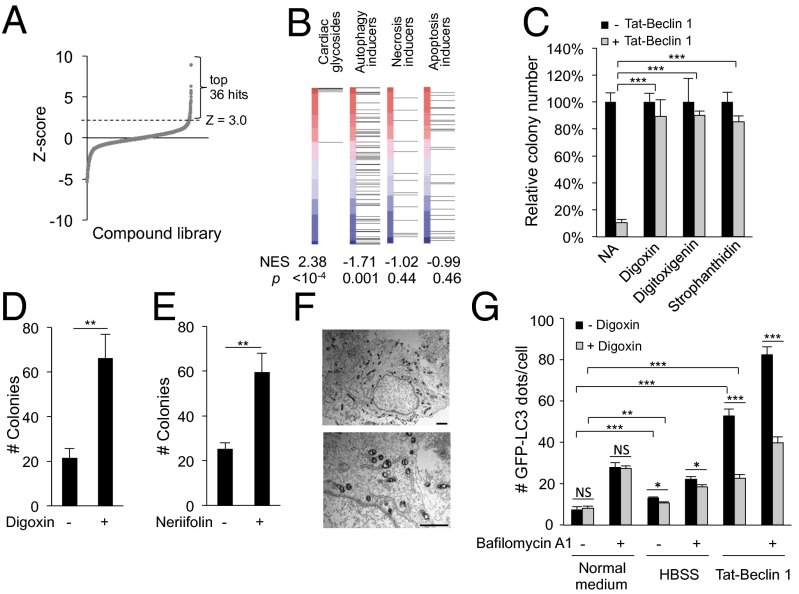
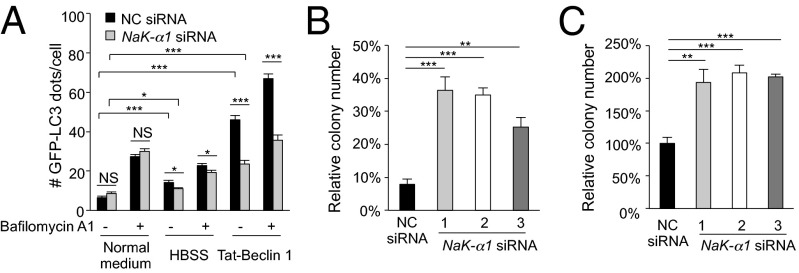
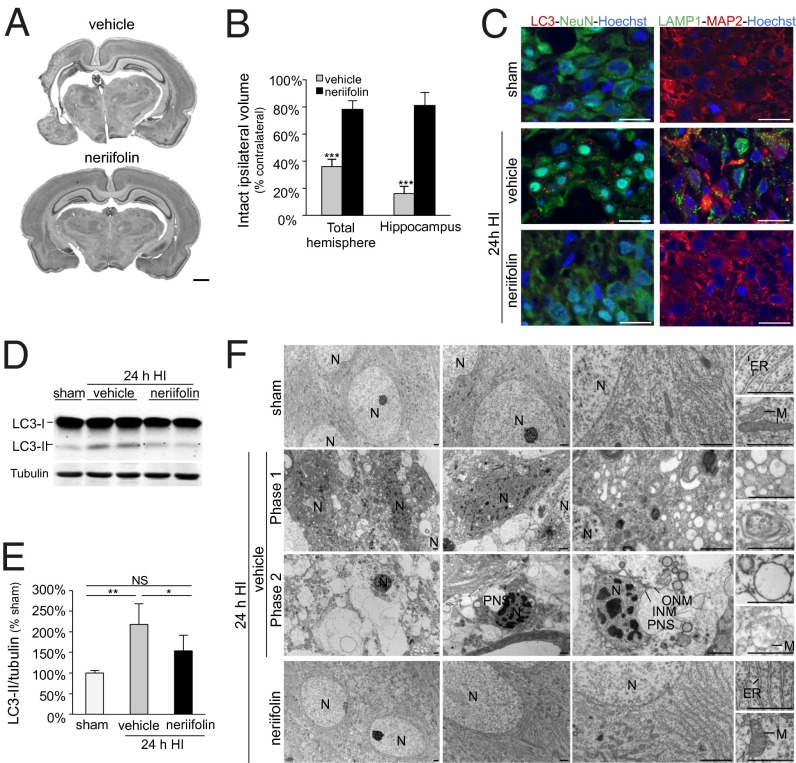
A long-standing controversy is whether autophagy is a bona fide cause of mammalian cell death. We used a cell-penetrating autophagy-inducing peptide, Tat-Beclin 1, derived from the autophagy protein Beclin 1, to investigate whether high levels of autophagy result in cell death by autophagy. Here we show that Tat-Beclin 1 induces dose-dependent death that is blocked by pharmacological or genetic inhibition of autophagy, but not of apoptosis or necroptosis. This death, termed "autosis," has unique morphological features, including increased autophagosomes/autolysosomes and nuclear convolution at early stages, and focal swelling of the perinuclear space at late stages. We also observed autotic death in cells during stress conditions, including in a subpopulation of nutrient-starved cells in vitro and in hippocampal neurons of neonatal rats subjected to cerebral hypoxia-ischemia in vivo. A chemical screen of ~5,000 known bioactive compounds revealed that cardiac glycosides, antagonists of Na(+),K(+)-ATPase, inhibit autotic cell death in vitro and in vivo. Furthermore, genetic knockdown of the Na(+),K(+)-ATPase α1 subunit blocks peptide and starvation-induced autosis in vitro. Thus, we have identified a unique form of autophagy-dependent cell death, a Food and Drug Administration-approved class of compounds that inhibit such death, and a crucial role for Na(+),K(+)-ATPase in its regulation. These findings have implications for understanding how cells die during certain stress conditions and how such cell death might be prevented.


Conflict of interest statement

The authors declare no conflict of interest.

Figures

Fig. 1.
Fig. 1.
Tat-Beclin 1 induces autophagy-dependent cell death. (A) Western blot of LC3 and p62 in HeLa cells treated with Tat-Scrambled (T-S) or Tat-Beclin 1 (T-B) peptides for 5 h. (B) Cell death of HeLa cells treated T-S or T-B for 5 h. (C) Representative images of Sytox Green staining of HeLa cells treated with T-S or T-B (20 µM, 5 h). (Scale bar, 50 µm.) (D) Clonogenic cell survival of HeLa cells treated with T-S or T-B (20 µM, 5 h). (E) Clonogenic survival of HeLa cells treated with T-B (20 µM, 4 h) ± 10 mM 3-MA. (F) Clonogenic survival of siRNA-transfected HeLa cells treated with T-B (20 µM, 3h). (G) Clonogenic survival of doxycycline (Dox)-inducible U2OS/TR cells stably transfected with empty vector, shATG13, or shATG14 ± Dox (1 µg/mL) for 5 d before treatment with T-B (25 µM, 5 h). For B and DG, error bars represent mean ± SEM and similar results were observed in three independent experiments. For DG, the number of colonies in untreated controls was standardized as 100%. NS, not significant; **P < 0.01; ***P < 0.001; t test. See also Fig. S1.
Fig. 2.
Fig. 2.
Tat-Beclin 1-induced cell death does not require the apoptotic or necroptotic machinery. (A) Clonogenic survival of wild-type and Bax−/−;Bak−/− MEFs treated with peptide (5 h). (B) Clonogenic survival of wild-type, Ripk1+/+;Ripk3−/−, and Ripk1−/−;Ripk3−/− MEFs treated with peptide (20 µM, 5 h). In A and B, the number of colonies of Tat-Scrambled-treated cells was standardized as 100%. (C) Western blot of cleaved caspase 3 and cleaved PARP in HeLa cells treated with 20 µM Tat-Scrambled (T-S), 20 µM Tat-Beclin 1 (T-B), 1 µM staurosporine (STS) ± 100 µM Z-VAD-FMK (z-VAD), or 32 mM H2O2 for 5 h. The asterisk denotes a cross-reacting band. (D) Representative images of cleaved caspase 3 staining in HeLa cells treated with 20 µM Tat-Beclin 1 or 1 µM staurosporine for 5 h. Scale bar, 50 µm. For A and B, error bars represent mean ± SEM of triplicate samples and similar results were observed in three independent experiments. NS, not significant; t test. See also Fig. S2.
Fig. 3.
Fig. 3.
Morphological features of Tat-Beclin 1-induced autosis. (A) Representative live-cell imaging of HeLa cells treated with 25 µM Tat-Beclin 1 for 5 h (Movie S1; times shown as hh:mm). The black arrow denotes released intracellular components from a ruptured cell membrane and the white arrow denotes perinuclear space between the inner nuclear membrane and cytoplasm at a region of nuclear concavity. (Scale bar, 10 µm.) (B) Representative images of mitochondrial (Tom20), ER (PDI), late endosome/lysosome (LAMP1), and nuclear lamin-A/C staining in HeLa cells treated with Tat-Scrambled (T-S) or Tat-Beclin 1 (T-B) (20 µM, 5 h). (Scale bar, 20 µm.) (C) EM analysis of HeLa cells treated with peptide (20 µM, 5 h). White arrows show dilated and fragmented ER; black arrows show regions where the perinuclear space has swollen and contains clumps of cytoplasmic material. (Scale bars, 1 µm.) See also Fig. S3.
Fig. 4.
Fig. 4.
Starvation induces autosis. (A) Representative images of active caspase-3 staining in HeLa cells 48 h after starvation (HBSS). (Center) Active caspase 3-positive floating cells with rounded nuclei. (Right) Active caspase 3-negative adherent cell with concave nucleus and swollen perinuclear space. (Scale bar, 20 µm.) (B and C) Representative images (B) and quantitation (C) of GPF-LC3 dots (autophagosomes) in HeLa/GFP-LC3 cells (>50 cells analyzed per sample) grown in normal medium or in floating and adherent HeLa/GFL-LC3 cells 6 h after starvation. (Scale bar, 10 µm.) (D) (Upper) EM images of phase-1 substrate-adherent HeLa cell 6 h after starvation. (Lower) CLEM images of phase-2 substrate-adherent HeLa cell with concave nucleus and swollen perinuclear space (PNS) (arrow) 8 h after starvation. (Lower Left) Phase contrast microscopy; (Lower Center and Lower Right) EM of same cell. The black arrow in Right Lower shows outer nuclear membrane (ONM) and the white arrow shows inner nuclear membrane (INM). (Scale bars, 1 µm.) (E) Representative images of a Sytox Green-positive adherent primary murine BMDM and MEF 48 h after starvation. (Scale bar, 10 µm.) (F) Clonogenic survival of siRNA-transfected adherent HeLa cells starved for 48 h. NC, nontargeting control siRNA. (G) Clonogenic survival of doxycycline (Dox)-inducible adherent U2OS/TR and U2OS/shATG14 cells ± Dox treatment (1 µg/mL) for 5 d before starvation for 72 h. (H) Clonogenic survival of adherent BMDMs (two mice per genotype; Atg5fl/fl;Lyz-Cre and Atg5fl/fl;Lyz-Cre+ littermates) starved for 72 h. For C and FH, error bars represent mean ± SEM of triplicate samples and similar results were observed in three independent experiments. For A, B and E, arrows denote concave nucleus and swollen perinuclear space. NS, not significant; **P < 0.01; ***P < 0.001; t test. See also Fig. S4.
Fig. 5.
Fig. 5.
Morphological features of cerebral hypoxia–ischemia-induced autosis. EM analysis of dying neurons in hippocampal region CA3 in brains of 7-d-old rats 24 h after exposure to cerebral hypoxia–ischemia. Arrows show regions where the perinuclear space is swollen and contains clumps of cytoplasmic material. (Scale bars, 1 µm.) GA, Golgi apparatus; INM, inner nuclear membrane; M, mitochondrion; N, nucleus; ONM, outer nuclear membrane; PNS, perinuclear space.
Fig. 6.
Fig. 6.
Cardiac glycosides rescue autosis. (A) Ranked distribution of z scores for each compound in primary chemical screen (Dataset S1) for inhibitors of Tat-Beclin 1-induced cell death. Thirty-six top hits with z ≥ 3.0 (Dataset S2) were selected for a secondary screen (Dataset S3). (B) Comparison of CSEA of cardiac glycosides in the primary autosis screening with compound sets of specific autophagy, necrosis, or apoptosis inducers. P, permutation P value for the NES compared with a null distribution. Red–blue vertical bars represent list of screened compounds, ranked according to z score (greatest rescue of autosis at top). Each horizontal line indicates where a specific compound falls within ranked compound list. (C) Clonogenic survival of HeLa cells treated with Tat-Beclin 1 (20 µM, 5 h) + 5 µM digoxin, digitoxigenin, or strophanthidin. The number of colonies of untreated cells was standardized as 100%. (D and E) Clonogenic survival of adherent HeLa cells starved for 48 h ± 10 nM digoxin (D) or 1 nM neriifolin (E). (Nanomolar concentrations were used as toxicity of digoxin and neriifolin was observed during starvation with micromolar concentrations.) (F) Representative EM images of a HeLa cell treated with 20 µM Tat-Beclin 1 + 5 µM digoxin (5 h). (Scale bar, 1 µm.) (G) Quantitation of GFP-LC3 dots (>100 cells analyzed per sample) in HeLa/GFP-LC3 cells treated with 20 µM Tat-Beclin 1 or starved in HBSS for 2 h ± 0.1 µM digoxin and/or 20 nM bafilomycin A1. For CE and G, error bars represent mean ± SEM of triplicate samples and similar results were observed in three independent experiments. NS, not significant; *P < 0.05; **P < 0.01; ***P < 0.001; t test. See also Figs. S5 and S6 and Datasets S1–S4.
Fig. 7.
Fig. 7.
Na+,K+-ATPase regulates autosis. (A) Quantitation of GFP-LC3 dots (>100 cells analyzed per sample) in HeLa/GFP-LC3 cells 72 h after transfection with indicated siRNA and treatment with Tat-Beclin 1 (20 µM, 2 h) or starvation (HBSS, 2 h) ± 20 nM bafilomycin A1. (B) Clonogenic survival of HeLa cells transfected with indicated siRNA for 72 h and then treated with Tat-Scrambled or Tat-Beclin 1 (20 µM, 5 h). Shown are the percentage of colonies in Tat-Beclin 1– vs. Tat-Scrambled–treated cells for each siRNA. (C) Clonogenic survival of adherent HeLa cells transfected with indicated siRNA for 72 h, and then starved for 48h. Clonogenic survival of control siRNA transfected cells in starvation conditions relative to normal medium standardized as 100%. For AC, error bars represent mean ± SEM of triplicate samples and similar results were observed in three independent experiments. NS, not significant; *P < 0.05; **P < 0.01; ***P < 0.001; t test. See also Fig. S7.
Fig. 8.
Fig. 8.
Neonatal hypoxic–ischemic brain damage and hippocampal CA3 region autophagy and autosis are reduced by treatment with the cardiac glycoside, neriifolin. (A) Representative Nissl-stained coronal sections through the brain showing the neuroprotective effect of neriifolin (Lower) compared with vehicle (Upper) 1 wk after hypoxia–ischemia (HI). (Scale bar, 1 mm.) (B) Volumes of intact tissue ipsilaterally compared with contralaterally 1 wk after neonatal cerebral hypoxia–ischemia and indicated treatment. Values are mean ± SD (n = 6 for neriifolin and n = 9 for vehicle). ***P < 0.001; Welch’s ANOVA test. (C) Representative confocal microscopy images of LC3 dots (red) and LAMP1 dots (green) in CA3 hippocampal neurons after 24h hypoxia–ischemia and indicated treatment or sham operation. NeuN (green) and MAP2 (red) are neuronal markers. Hoechst staining (blue) shows cell nuclei. (Scale bars, 20 µm.) (D and E) Representative LC3 immunoblots (D) and quantification of LC3-II/tubulin levels (E) from immunoblots of hippocampi of rats subjected to hypoxia–ischemia. Values are mean ± SD (n = 6 for neriifolin and n = 9 for vehicle). NS, not significant; *P < 0.05; **P < 0.001; Kruskal–Wallis test. (F) EM analysis of neriifolin effects in hippocampal region CA3 of 7-d-old rats 24 h after hypoxia–ischemia. INM, inner nuclear membrane; M, mitochondrion; N, nucleus; ONM, outer nuclear membrane; PNS, perinuclear space. (Scale bars, 1 µm.)

Comment in

References

    1. Levine B, Kroemer G. Autophagy in the pathogenesis of disease. Cell. 2008;132(1):27–42. - PMC - PubMed
    1. Galluzzi L, et al. Molecular definitions of cell death subroutines: Recommendations of the Nomenclature Committee on Cell Death 2012. Cell Death Differ. 2012;19(1):107–120. - PMC - PubMed
    1. Clarke PGH. Developmental cell death: Morphological diversity and multiple mechanisms. Anat Embryol (Berl) 1990;181(3):195–213. - PubMed
    1. Lockshin RA, Zakeri Z. Apoptosis, autophagy, and more. Int J Biochem Cell Biol. 2004;36(12):2405–2419. - PubMed
    1. Levine B, Yuan J. Autophagy in cell death: An innocent convict? J Clin Invest. 2005;115(10):2679–2688. - PMC - PubMed

Publication types

MeSH terms

Substances