

Spectral redemption in clustering sparse networks
- PMID: 24277835
- PMCID: PMC3876200
- DOI: 10.1073/pnas.1312486110
Spectral redemption in clustering sparse networks
Abstract
Spectral algorithms are classic approaches to clustering and community detection in networks. However, for sparse networks the standard versions of these algorithms are suboptimal, in some cases completely failing to detect communities even when other algorithms such as belief propagation can do so. Here, we present a class of spectral algorithms based on a nonbacktracking walk on the directed edges of the graph. The spectrum of this operator is much better-behaved than that of the adjacency matrix or other commonly used matrices, maintaining a strong separation between the bulk eigenvalues and the eigenvalues relevant to community structure even in the sparse case. We show that our algorithm is optimal for graphs generated by the stochastic block model, detecting communities all of the way down to the theoretical limit. We also show the spectrum of the nonbacktracking operator for some real-world networks, illustrating its advantages over traditional spectral clustering.
Conflict of interest statement
The authors declare no conflict of interest.
Figures
 ,
,  , and
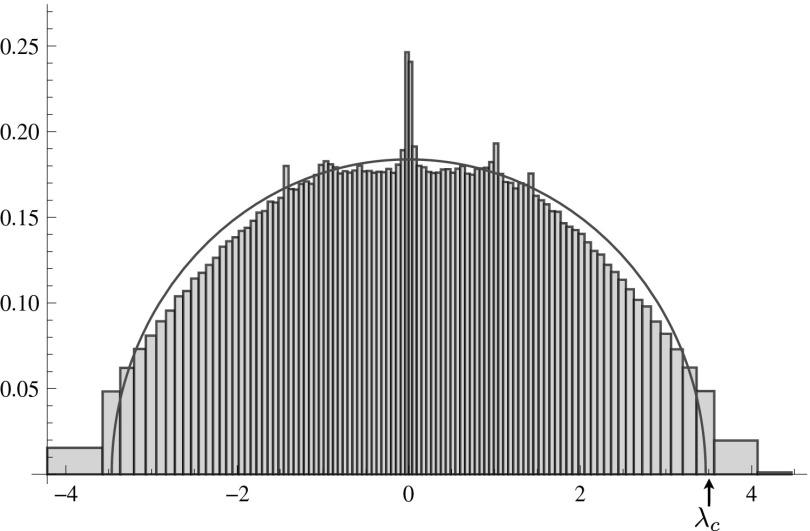
, and  , and we average over 20 realizations. Even though the eigenvalue
  given by Eq. 2 satisfies the threshold condition 1 and lies outside the semicircle of radius
  , deviations from the semicircle law cause it to get lost in the bulk, and the eigenvector of the second largest eigenvalue is uncorrelated with the community structure. As a result, spectral algorithms based on A are unable to identify the communities in this case.
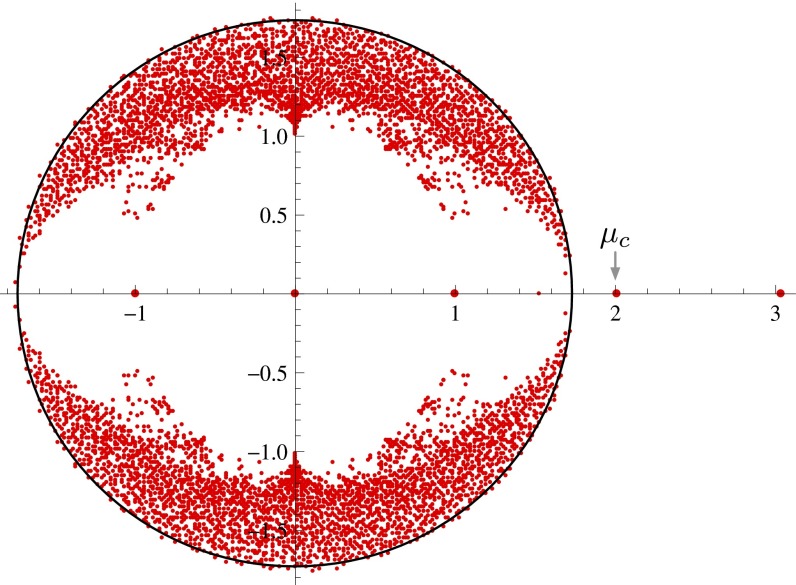
 , the second eigenvalue is close to
  , and the bulk of the spectrum is confined to the disk of radius
  . Because
  is outside the bulk, a spectral algorithm that labels vertices according to the sign of B’s second eigenvector (summed over the incoming edges at each vertex) labels the majority of vertices correctly.
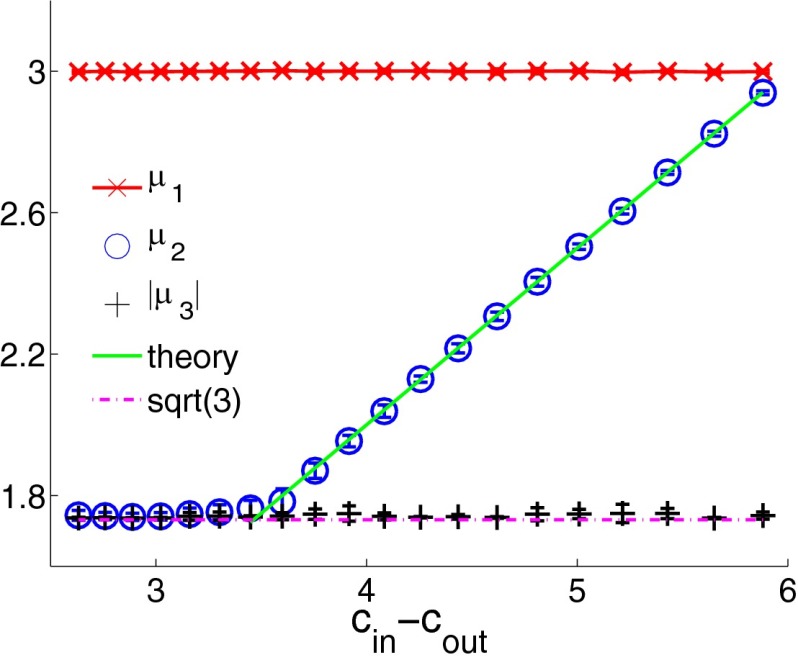
 ,
,  , and
, and  , respectively, of B as functions of
  . The third eigenvalue is complex, so we plot its modulus. Values are averaged over 20 networks of size
  and average degree
  . The green line in the figure represents
  , and the horizontal lines are c and
  , respectively. The second eigenvalue
  is well-separated from the bulk throughout the detectable regime.
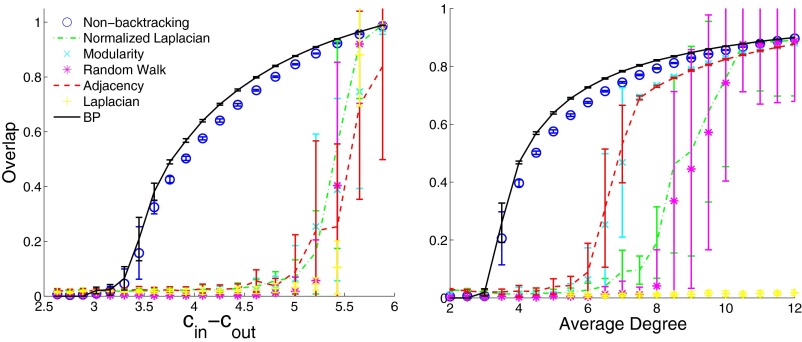
 while fixing the average degree
  ; the detectability transition given by 1 occurs at
  . (Right) We set
  and vary c; the detectability transition is at
  . Each point is averaged over 20 instances with
  . Our spectral algorithm based on the nonbacktracking matrix B achieves an accuracy close to that of BP, and both remain large all of the way down to the transition. Standard spectral algorithms (applied to the giant component of each graph, which contains all but a small fraction of the vertices) based on the adjacency matrix, modularity matrix, Laplacian, normalized Laplacian, and the random walk matrix all fail well above the transition, giving a regime where they do no better than chance.
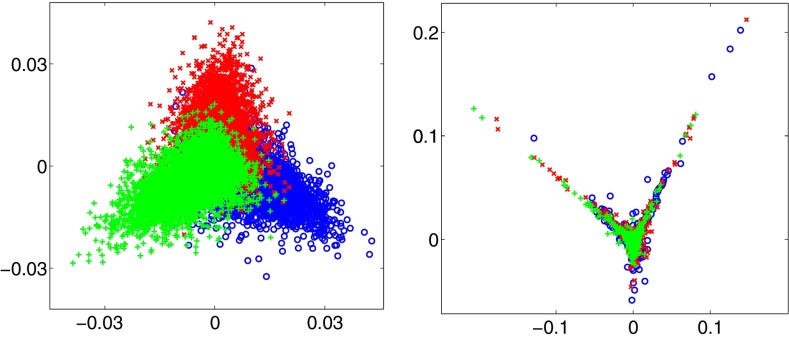
 ,
,  , and
, and  . Applying k means gives an overlap 0.712 using B, but 0.0063 using A.
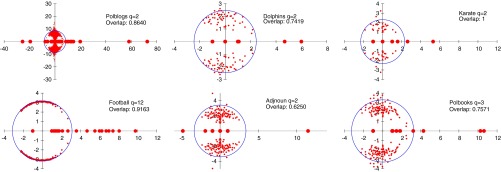
References
-
- Holland PW, Laskey KB, Leinhardt S. Stochastic blockmodels: First steps. Soc Networks. 1983;5(2):109–137.
-
- Wang YJ, Wong GY. Stochastic blockmodels for directed graphs. J Am Stat Assoc. 1987;82(397):8–19.
-
- Von Luxburg U. A tutorial on spectral clustering. Stat Comput. 2007;17(4):395–416.
-
- Coja-Oghlan A, Mossel E, Vilenchik D. A spectral approach to analyzing belief propagation for 3-coloring. Combin Probab Comput. 2009;18(6):881–912.
Publication types
MeSH terms
LinkOut - more resources
Full Text Sources
Other Literature Sources
