

Dread and the disvalue of future pain
- PMID: 24277999
- PMCID: PMC3836706
- DOI: 10.1371/journal.pcbi.1003335
Dread and the disvalue of future pain
Abstract
Standard theories of decision-making involving delayed outcomes predict that people should defer a punishment, whilst advancing a reward. In some cases, such as pain, people seem to prefer to expedite punishment, implying that its anticipation carries a cost, often conceptualized as 'dread'. Despite empirical support for the existence of dread, whether and how it depends on prospective delay is unknown. Furthermore, it is unclear whether dread represents a stable component of value, or is modulated by biases such as framing effects. Here, we examine choices made between different numbers of painful shocks to be delivered faithfully at different time points up to 15 minutes in the future, as well as choices between hypothetical painful dental appointments at time points of up to approximately eight months in the future, to test alternative models for how future pain is disvalued. We show that future pain initially becomes increasingly aversive with increasing delay, but does so at a decreasing rate. This is consistent with a value model in which moment-by-moment dread increases up to the time of expected pain, such that dread becomes equivalent to the discounted expectation of pain. For a minority of individuals pain has maximum negative value at intermediate delay, suggesting that the dread function may itself be prospectively discounted in time. Framing an outcome as relief reduces the overall preference to expedite pain, which can be parameterized by reducing the rate of the dread-discounting function. Our data support an account of disvaluation for primary punishments such as pain, which differs fundamentally from existing models applied to financial punishments, in which dread exerts a powerful but time-dependent influence over choice.
Conflict of interest statement
The authors have declared that no competing interests exist.
Figures
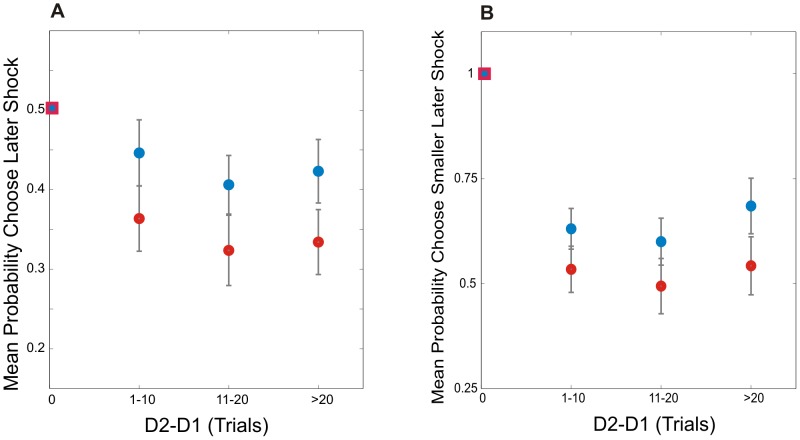
 (Choose S2) = 0.5, represented by the blue and red square. Blue circles represent choice probabilities for the relief frame, red circles choice probabilities for the pain frame. Error bars represent one standard error from the between subject mean. A 2-way repeated ANOVA revealed a significant main effect of both frame [F(1,24) = 9.505; p = 0.005)] and delay [F(3,72) = 8.156; p = 0.002)], as well as a significant delay by frame interaction [F(3,72) = 4.169; p = 0.023)]. B: Choice probabilities for choices in which the more delayed option was a smaller number of shocks. At delay difference of zero, S1 and S2 would occur at the same time-point, under which circumstance it might be assumed that participants would show preference for the smaller number of shocks, denoted by the blue and red square.
 , is set to 0.25, a representative value.
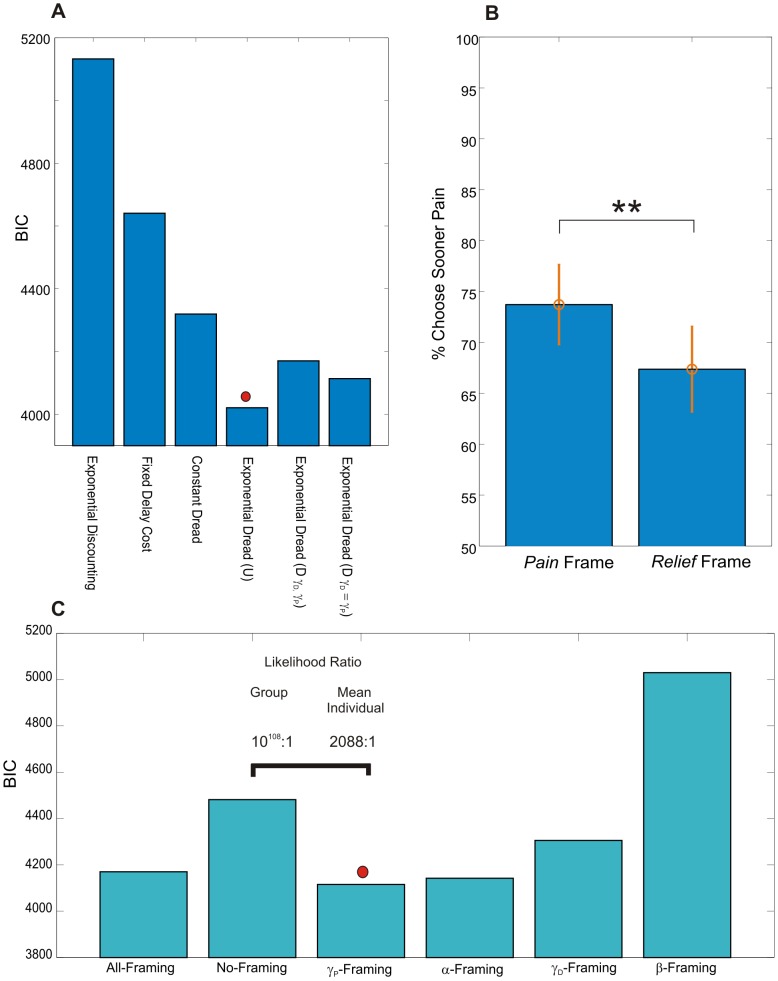
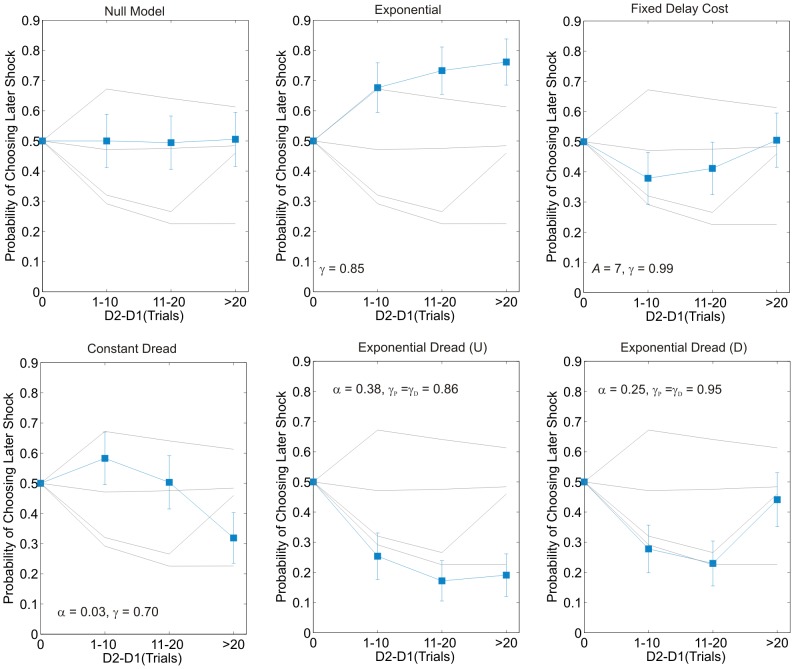
 ), summed across participants (N = 25) for the alternative models. Lower values of
  indicate better fits of the model. Exponential Dread outperformed other models, with Undiscounted Exponential Dread providing the most parsimonious fit at the group level, indicated by the red circle. B: Mean frequency of choosing sooner pain across all choices by all participants in either frame. Error bars show one standard error from the mean in each direction. Two-tailed paired t-test showed significant difference between the two frames t(32) = 2.84, p = 0.0077. This result was confirmed with non-parametric testing for differences between paired samples using the Wilcoxon Signed Rank test, which revealed significant differences between the two medians (N = 33, Z = −2.6, p = 0.0093). C: Results of fitting the general form Exponential Dread model to both pain and relief frames, whilst restricting which parameters were allowed to vary between frames. In the unrestricted framing model (All-Framing) all four parameters, the inverse softmax temperature,
  , the discount parameters,
  and
and  , and the anticipation parameter,
  , were applied separately to each frame, yielding an eight parameter model. In the fully restricted framing model (No-Framing) all parameters were constrained to be equal across frames, yielding a four-parameter model. The best fit, indicated by the red circle, was provided by a four-parameter model in which
  ,
,  and
and  were fixed across frames, leaving between-frame differences explained by differences in
  (
( -Framing). Likelihood ratios are displayed at both the group level and the individual level, strongly favoring the
  -Framing model over the No-Framing model at both the group (fixed effects) (LR = 10108∶1, χ2 = 497.3, p<0.001, d. f. = 25) and individual levels (Mean individual LR = 2088∶1, χ2 = 19.9, p<0.001, d. f. = 1) .
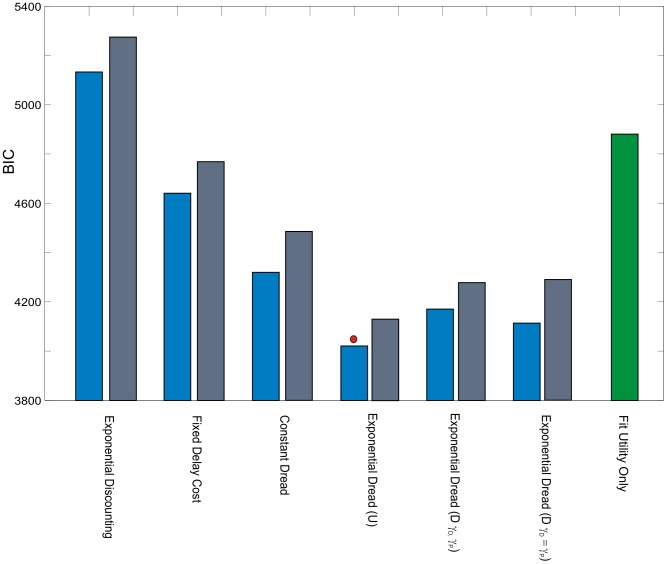
 values for linear utility models, gray bars the
  values for non-linear utility models. For each alternative model using linear utility provided better model fits, as indicated by lower
  values. Importantly, the rank order of the models was largely unchanged using non-linear utility, the only exception being that the general form Exponential Dread model outperformed the Restricted Discounted version with non-linear utility, but not with linear utility. The green bar labelled “Fit Utility Only” represents the result of implementing the Null model with a freely fitted three-parameter Weibull utility function, showing that a variable utility function alone was unable to account competitively for the observed data.
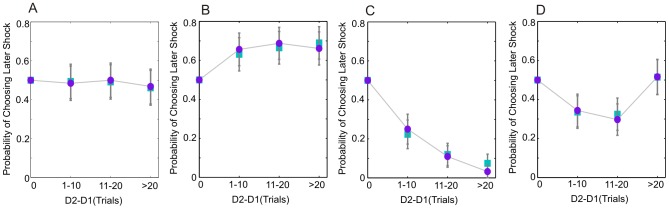
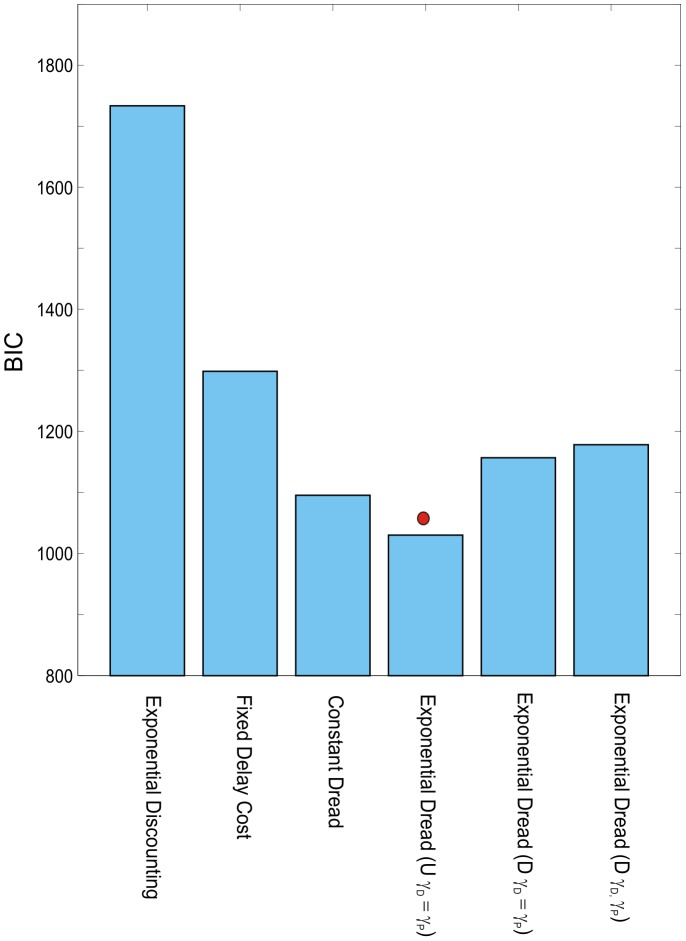
 ), summed across participants (N = 30) for the alternative models. Lower values of
  indicate better fits of the model. Undiscounted Exponential Dread provided the most parsimonious fit at the group level, indicated by the red circle.
References
-
- Strotz (1957) Myopia and inconsistency in dynamic utility maximisation. Rev Econ Stud 23: 165–180.
-
- Mazur J (1987) An adjusting procedure for studying delayed reinforcement. In: Commons, Mazur, Nevin, Rachlin, editors. Quantitative Analysis of Behavior. Hillsdale, NJ: Erlbaum. pp. 55–73.
-
- Benzion U, Rapoport A, Yagil J (1989) Discount rates inferred from decisions - an experimental-study. Manage Sci 35: 270–284.
-
- Green L, Fristoe N, Myerson, et al (1994) Temporal discounting and preference reversals in choice between delayed outcomes. Psychon B & Rev 1: 383–389. - PubMed
Publication types
MeSH terms
Grants and funding
LinkOut - more resources
Full Text Sources
Other Literature Sources
Medical
