. 2013;9(11):e1003346.
doi: 10.1371/journal.pcbi.1003346. Epub 2013 Nov 21.

Systematic analysis of compositional order of proteins reveals new characteristics of biological functions and a universal correlate of macroevolution

Affiliations

Systematic analysis of compositional order of proteins reveals new characteristics of biological functions and a universal correlate of macroevolution

Erez Persi et al. PLoS Comput Biol. 2013.

Abstract

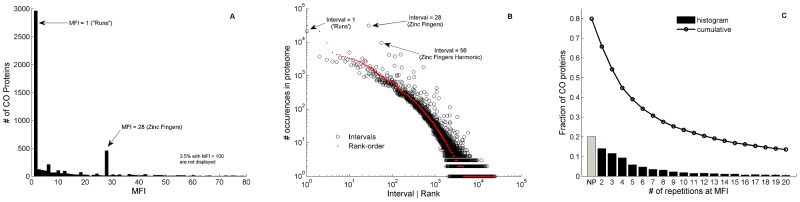
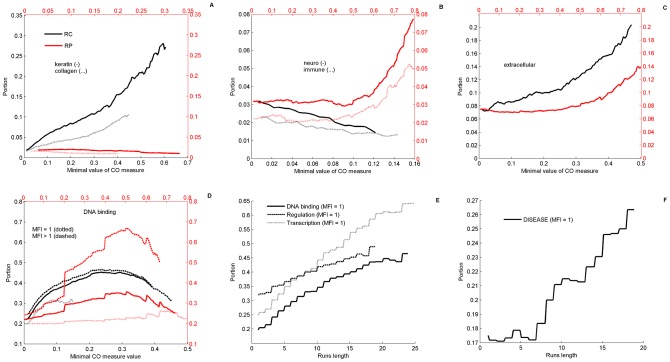
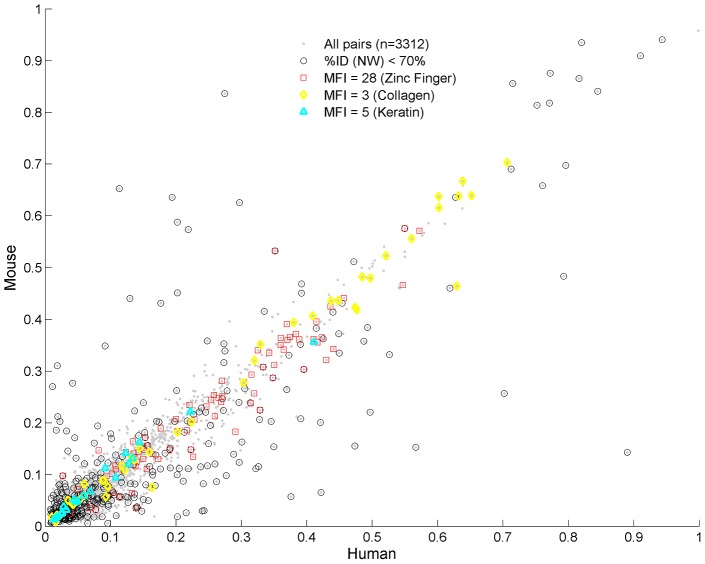
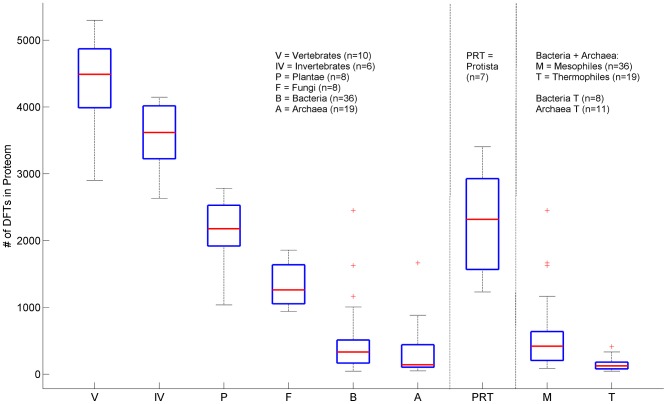
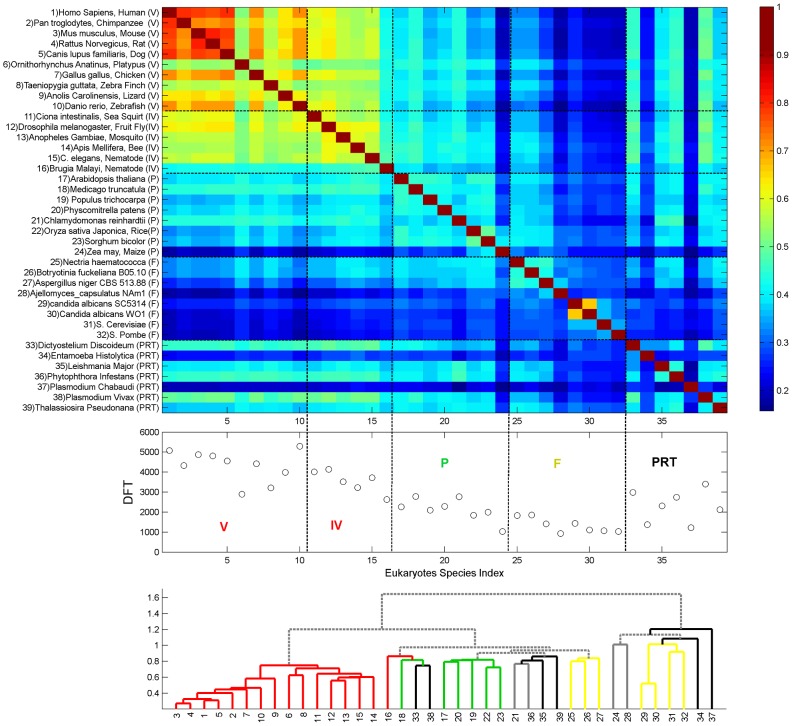
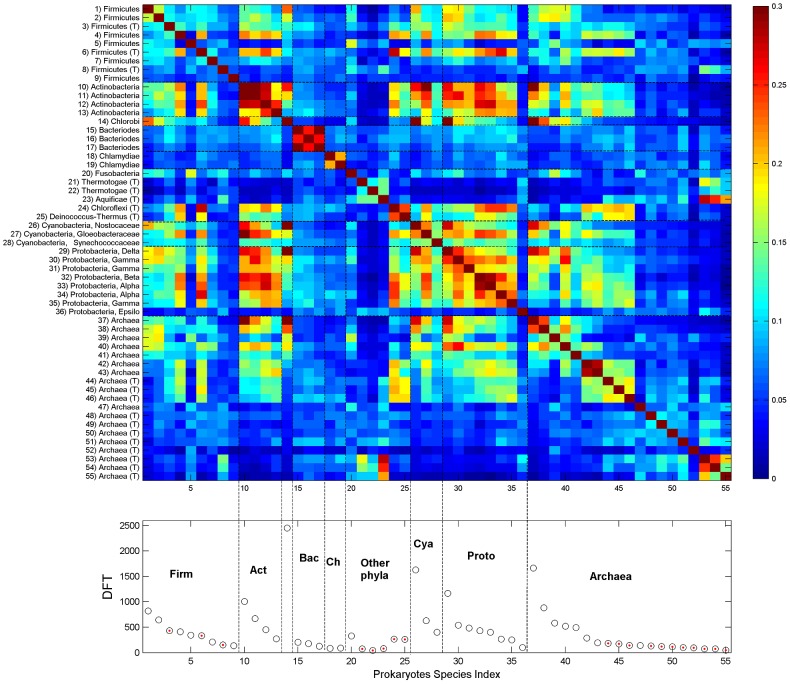
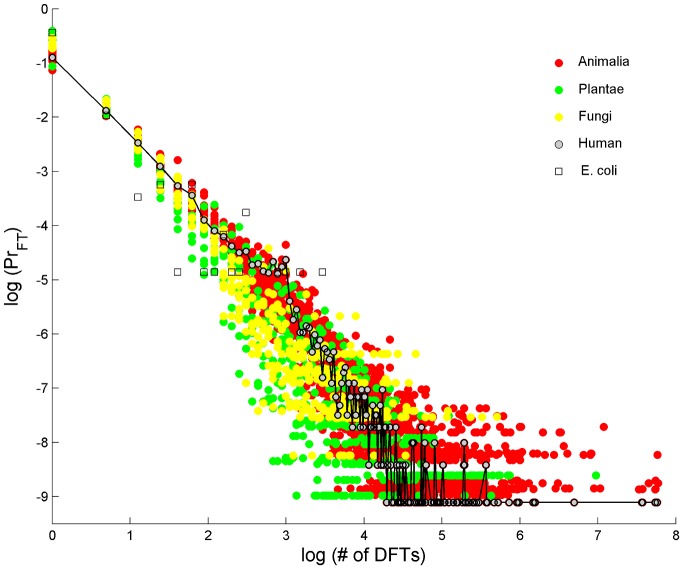
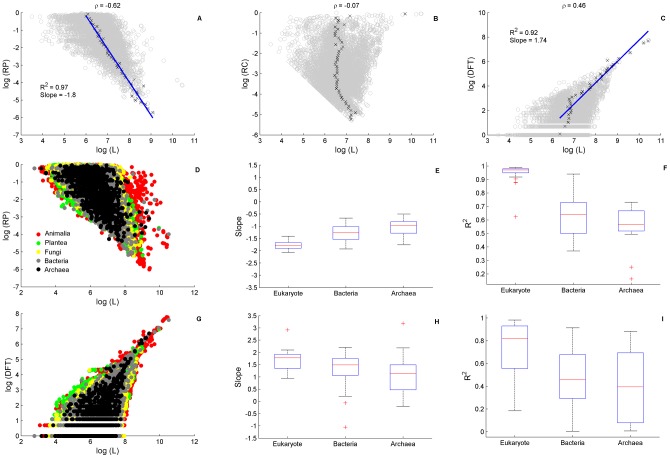
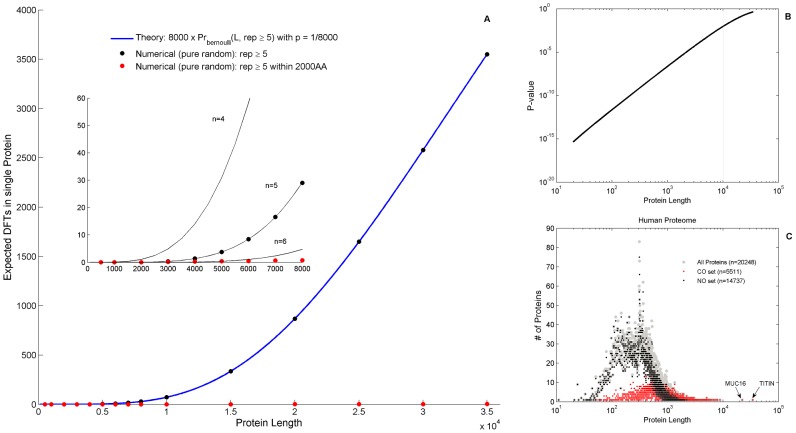
We present a novel analysis of compositional order (CO) based on the occurrence of Frequent amino-acid Triplets (FTs) that appear much more than random in protein sequences. The method captures all types of proteomic compositional order including single amino-acid runs, tandem repeats, periodic structure of motifs and otherwise low complexity amino-acid regions. We introduce new order measures, distinguishing between 'regularity', 'periodicity' and 'vocabulary', to quantify these phenomena and to facilitate the identification of evolutionary effects. Detailed analysis of representative species across the tree-of-life demonstrates that CO proteins exhibit numerous functional enrichments, including a wide repertoire of particular patterns of dependencies on regularity and periodicity. Comparison between human and mouse proteomes further reveals the interplay of CO with evolutionary trends, such as faster substitution rate in mouse leading to decrease of periodicity, while innovation along the human lineage leads to larger regularity. Large-scale analysis of 94 proteomes leads to systematic ordering of all major taxonomic groups according to FT-vocabulary size. This is measured by the count of Different Frequent Triplets (DFT) in proteomes. The latter provides a clear hierarchical delineation of vertebrates, invertebrates, plants, fungi and prokaryotes, with thermophiles showing the lowest level of FT-vocabulary. Among eukaryotes, this ordering correlates with phylogenetic proximity. Interestingly, in all kingdoms CO accumulation in the proteome has universal characteristics. We suggest that CO is a genomic-information correlate of both macroevolution and various protein functions. The results indicate a mechanism of genomic 'innovation' at the peptide level, involved in protein elongation, shaped in a universal manner by mutational and selective forces.


Conflict of interest statement

The authors have declared that no competing interests exist.

Figures

Figure 1
Figure 1. Analysis of Swiss-Prot human proteome.
Analysis of Swiss-Prot human proteome (n = 20248) containing 5511 CO proteins. A) Histogram of the most frequent intervals, MFI, demonstrates the significant periodic structures originating in ‘runs’ of homo-peptides (MFI = 1) and zinc-fingers (MFI = 28). B) The frequency of intervals of all FTs in all proteins (black circles). The outstanding symbols are mostly due to Zinc-finger proteins which form repetitive sections of 28 amino-acids. Multiplicities at intervals 56, 84 amino-acid are also evident due to mutation acting on these sections. The superimposed red dots display the data in a rank-ordered manner (i.e. the x-axis takes on the role of rank rather than value of interval). C) The number of periodic proteins as defined by the number of FT occurrences at MFI. The bars indicate the fraction of CO proteins with exactly 2–20 (x-axis) occurrences at MFI. 20% of CO proteins are non-periodic (NP). Circles represent the cumulative fraction of proteins with number of repetitions at MFI above the value indicated by the x-axis. Thus, for a minimum of 4 repeats at MFI (i.e., x = 3), there are above 50% CO proteins with periodic structures.
Figure 2
Figure 2. Repertoire of functional enrichments in human proteome.
Repertoire of enrichment dependencies of GO (gene ontology) terms on the order measures of regularity, RC (black), and periodicity, RP (red). Portions of proteins belonging to a functional group are estimated based on text search in GO terms (see methods) and plotted in double axes against increasing thresholds of RC (lower x-axis) and RP (upper x-axis). A) The portions of some terms that are enriched with increasing threshold of RC but not of RP, like keratin (solid) and collagen (dotted). In this category one finds also filament and cell adhesion related proteins. B) GO terms that are enriched only for increased RP threshold but not RC, as neuronal related proteins (solid) and immune system proteins (dotted). These include also synaptic function and cell response genes. C) Other terms like extracellular region are enriched with increasing the threshold of both RC and RP. D) Some functionalities show more complicated non-monotonic “bump” behaviors. These include DNA-binding, regulation and transcription. As an example, DNA binding are further analyzed showing functional dependencies on RP and RC of both repetitive sections (MFI>1) and runs (MFI = 1). E) MFI = 1 proteins exhibit stable enrichment pattern as function of the threshold on the sum of repetitions at MFI = 1 (i.e., the effective coverage of all amino-acids “runs”). F) Disease related proteins are enriched with increasing length of runs. In each plot, the portion of the corresponding GO-term in the entire CO Swiss-Prot reviewed proteome is the value displayed at 0.
Figure 3
Figure 3. Functional enrichment in A. Thaliana and S. cerevisiae.
Similarly to figure 2, functional enrichment in A. Thaliana (A–C) and S. cerevisiae (D–F) are shown with respect to RC (black) or RP (red). Portions of cell wall genes (A, D) and extracellular related genes (C, F) are enriched with increasing the threshold of RC, while portions of response related genes (B, E) are enriched with RP in A. thaliana but RC in yeast.
Figure 4
Figure 4. Comparison of CO orthologs in human and mouse.
Comparison of CO orthologs in human and mouse according to their RC values. Each point corresponds to a pair of such proteins (n = 3312). Low homologies are marked by circles. Usually, their CO sections are comparable, however revealing higher harmonics in the mouse (Text S1 - section 7, figure S11). Off-diagonal pairs always display low homologies. In the upper-left diagonal CO sections of human and mouse resemble each other, having high similarity of FTs and MFI, despite the low RC in human. In the lower-right diagonal mouse CO sections do not resemble human CO sections, except for few exceptions (see text). High homology is obtained for protein pairs with similar MFIs, such as zinc finger (MFI = 28), collagen (MFI = 3) and keratin (MFI = 5) proteins, and lie along the diagonal.
Figure 5
Figure 5. DFT Box-plot by Kingdom.
Box plots of DFT counts across the tree-of-life. Each box delineates lower quartile, median and upper quartile values. Most extreme values (whiskers) are within 1.5 times the inter-quartile range from the ends of the box. Outliers are also displayed. Prokaryotes are displayed twice. First divided according to bacteria and archaea, and secondly as mesophiles and thermophiles. P-values according to non-parametric two-sample Kolmogorov-Smirnov test are 2.5×10⁻² (V-IV), 6.5×10⁻³(IV-P), 9×10⁻³ (P-F), 1.7×10⁻⁵ (F-B), 2.3×10⁻²(B-A) and 1.4×10⁻⁴ (M-T). Protista species show large variability and cannot be distinguished from Plantae or Fungi. Abbreviations: Vertebrates (V), Invertebrates (IV), Plantae (P), Fungi (F), Protista (PRT) Bacteria (B) Archaea (A), Mesophiles (M), Thermophiles (T).
Figure 6
Figure 6. DFT enrichment in eukaryotes.
DFT count and correlation CIJ of the 39 studied eukaryotes. Species are indexed and ordered as in table 5, according to the kingdoms Animalia, Plantae, Fungi and within each kingdom, according to their phylogenetic distance. The upper panel shows the heat-map of the correlation CIJ, the middle panel shows the DFT counts, and the lower panel shows the tree of hierarchical clustering based on Euclidian average distance of CIJ. Colors of the branches correspond to the taxonomic identity as indicated by the colored abbreviations in the middle panel. Abbreviations are the same as defined in figure 5. Solid gray branch corresponds to two proximate ends-leafs belonging to different taxonomic groups. Dashed gray branches link groups.
Figure 7
Figure 7. DFT enrichment in prokaryotes.
DFT count and correlation CIJ of the 55 studied prokaryotes. Bacteria are grouped into phyla which are ordered according to their phylogenetic distance, from firmicutes to proteobacteria, and within each phylum species are ordered by DFT counts. Archaea are ordered by DFT counts. Upper panel displays the heatmap of CIJ, lower panel displays DFT counts (red points indicate thermophiles). Color scale is different from figure 6, in order to be able to trace trends which extend over several orders of magnitude. Abbreviations: Firmicutes (Firm); Actinobacteria (Act); Bacteriodes (Bac); Chlamydiae (Ch); Cyanobacteria (Cya), Protobacteria (Proto), Mesophiles (M), Thermophiles (T).
Figure 8
Figure 8. Universal DFT accumulation in proteomes.
Probability of a number of DFT in a protein, on log-log scale, for 32 eukaryotes proteomes, colored differently for Animalia (red), Plantae (green) and Fungi (yellow). Few FTs occur quite often in the proteome while many FTs are rare. The cases of human and E. coli are shown as specific examples. All individual eukaryote species are very well fitted by a pure power-law (see Text S1 - section 9). E. coli serves as an example of a typical prokaryote.
Figure 9
Figure 9. Universal dependence of RP and DFT on protein length.
The relationship, on a log-log scale, between the CO measures RP, RC and DFT and protein length, L. Upper panel (A–C) display human proteins indicating strong correlation of RP (A) and DFT (C) but not RC (B), ρ indicated the Pearson correlation coefficient. A clear linear boundary in RC is due to its lower bound 3/L. Linear regression analysis shows excellent power-law fits of RP and DFT dependence on L. Data was binned to 50 equally spaced intervals along the y-axis. ‘X’ symbols denote the average of L in each bin, error (SD) on the mean is at the size of the symbol and therefore not shown. The blue line is the result of a linear regression fit. Middle Panel (D–F) shows a superposition of RP-L data for all species (D) and the quality of its linear regression fits in (E,F). Slopes increase from Eukaryote to Prokaryotes (E) coupled with a decrease in the goodness of fit (F). Lower panel (G–I) is the same type of analysis for DFT-L dependence. Note that the slope trends are opposite. The ratio of the RP-L and DFT-L slopes is close to −1 in all species: it is −1.11±0.05 in eukaryotes. In prokaryotes, excluding 9 outliers, the ratio is −0.85±0.05.
Figure 10
Figure 10. Frequent Triplets – Theory and simulation.
Expected values of Frequent Triplets (FTs) in random proteins as function of sequence length. Length range is up to 35,000 amino-acids, approximately the length of the longest proteins found among the proteomes of the 94 species studied (TITIN in human, and beta-helical in Chlorobium). A) Blue curve is the theoretical expected value given by the Bernoulli probability, for n = 5. Dark circles are the corresponding results of a numerical search of triplets showing perfect match to the theoretical estimation. Red circles are the numerical results for restrictive FTs defined by n = 5 and M = 2000. Inset: same data is shown up to L = 8000 for clarity. Additional black curves represent the theoretical estimation for n = 4–6. B) P-value for FT misidentification as function of length on log-scale. C) Length distribution of human proteins showing log-normal characteristics. Length of CO proteins is right-shifted (see also Text S1 -section 3, figure S6d). Further analysis based on a human “unigram” reference model is provided in Text S1 - sections 1 and 2, where the few very long proteins are analyzed in detail.

Similar articles

Cited by

References

    1. Koonin EV, Wolf YI, Karev GP (2002) The structure of the protein universe and genome evolution. Nature 420: 218–223. - PubMed
    1. Katti MV, Sami-Subbu R, Ranjekar PK, Gupta VS (2000) Amino acid repeat patterns in protein sequences: Their diversity and structural-functional implications. Protein Science 9: 1203–1209. - PMC - PubMed
    1. Wootton JC, Federhen S (1993) Statistics of local complexity in amino acid sequences and sequence databases. Computers Chem 17 (2) 149–163.
    1. Levinson G, Gutman GA (1987) Slipped-Strand Mispairing: A Major Mechanism for DNA Sequence Evolution. Mol Biol Evol 4 (3) 203:221. - PubMed
    1. Wootton JC (1994) Sequences with ‘unusual’ amino acid compositions. Curr Opinion Struct Biology 4: 413–421.

Publication types

LinkOut - more resources