

Multiscale modeling of influenza A virus infection supports the development of direct-acting antivirals
- PMID: 24278009
- PMCID: PMC3836700
- DOI: 10.1371/journal.pcbi.1003372
Multiscale modeling of influenza A virus infection supports the development of direct-acting antivirals
Abstract
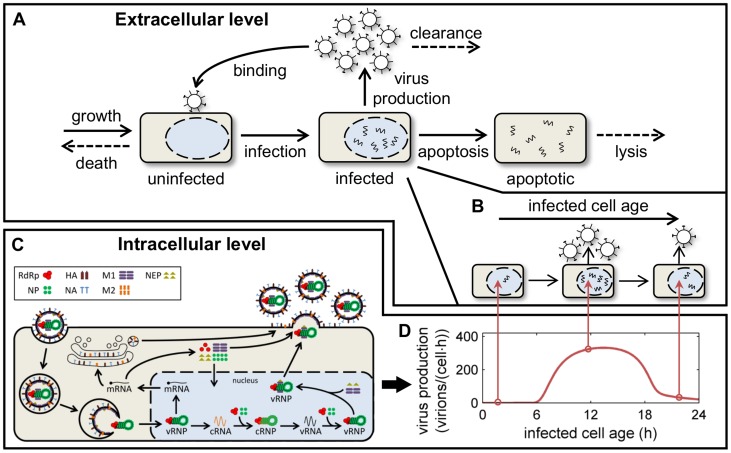
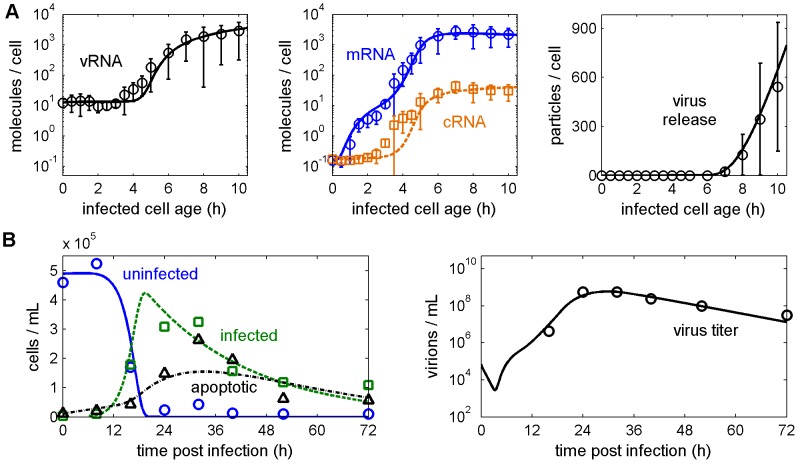
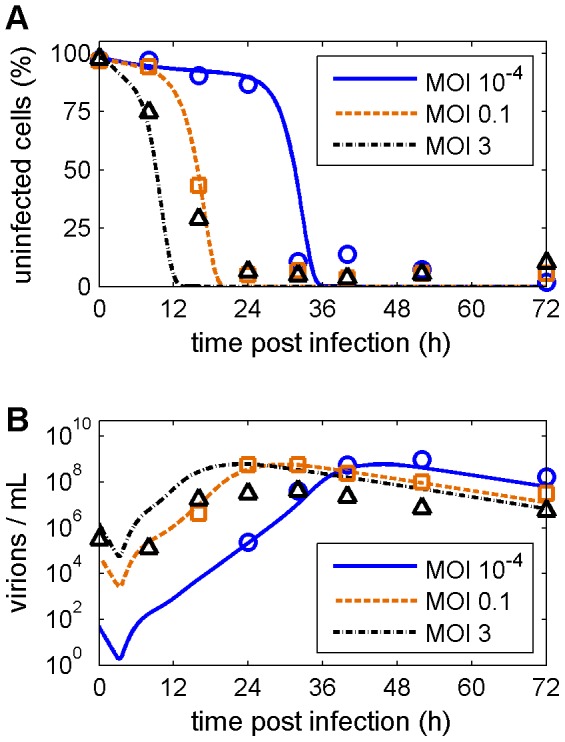
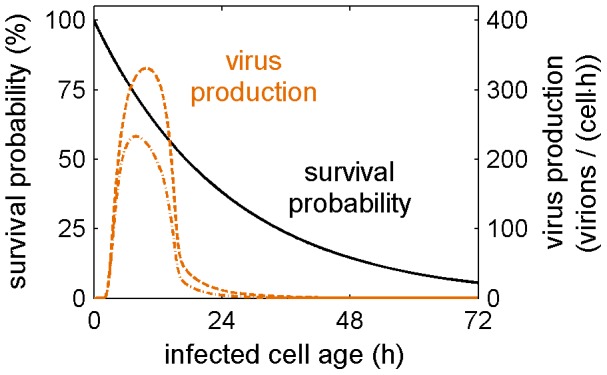
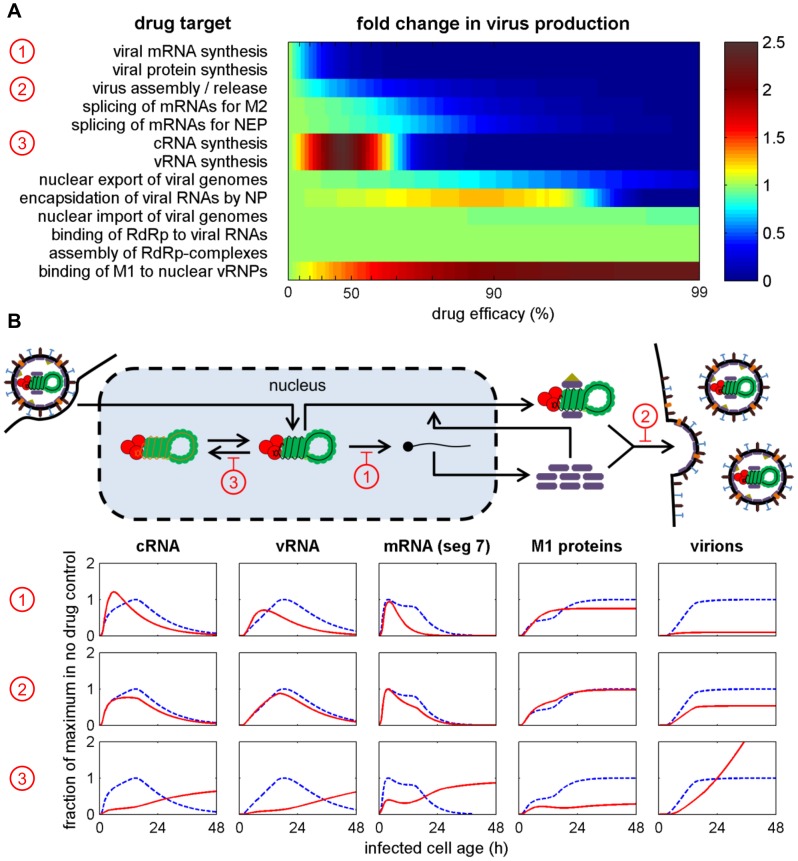
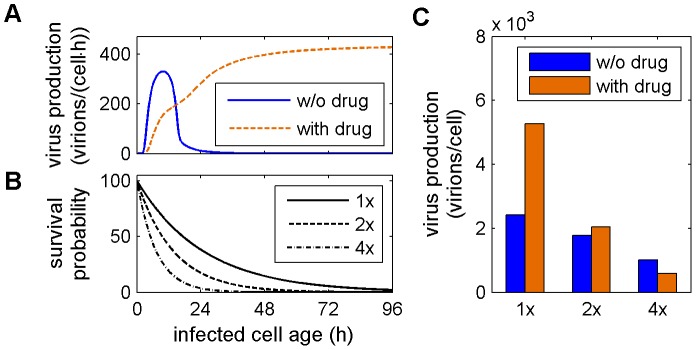
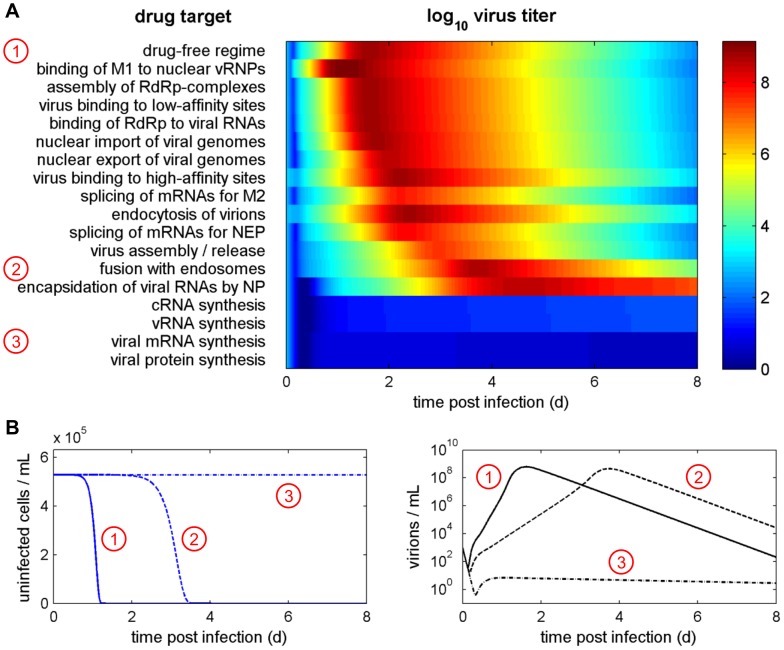
Influenza A viruses are respiratory pathogens that cause seasonal epidemics with up to 500,000 deaths each year. Yet there are currently only two classes of antivirals licensed for treatment and drug-resistant strains are on the rise. A major challenge for the discovery of new anti-influenza agents is the identification of drug targets that efficiently interfere with viral replication. To support this step, we developed a multiscale model of influenza A virus infection which comprises both the intracellular level where the virus synthesizes its proteins, replicates its genome, and assembles new virions and the extracellular level where it spreads to new host cells. This integrated modeling approach recapitulates a wide range of experimental data across both scales including the time course of all three viral RNA species inside an infected cell and the infection dynamics in a cell population. It also allowed us to systematically study how interfering with specific steps of the viral life cycle affects virus production. We find that inhibitors of viral transcription, replication, protein synthesis, nuclear export, and assembly/release are most effective in decreasing virus titers whereas targeting virus entry primarily delays infection. In addition, our results suggest that for some antivirals therapy success strongly depends on the lifespan of infected cells and, thus, on the dynamics of virus-induced apoptosis or the host's immune response. Hence, the proposed model provides a systems-level understanding of influenza A virus infection and therapy as well as an ideal platform to include further levels of complexity toward a comprehensive description of infectious diseases.
Conflict of interest statement
The authors have declared that no competing interests exist.
Figures
Similar articles
-
Discovery of dapivirine, a nonnucleoside HIV-1 reverse transcriptase inhibitor, as a broad-spectrum antiviral against both influenza A and B viruses.Antiviral Res. 2017 Sep;145:103-113. doi: 10.1016/j.antiviral.2017.07.016. Epub 2017 Aug 2. Antiviral Res. 2017. PMID: 28778830 Free PMC article.
-
Efficient Inhibition of Avian and Seasonal Influenza A Viruses by a Virus-Specific Dicer-Substrate Small Interfering RNA Swarm in Human Monocyte-Derived Macrophages and Dendritic Cells.J Virol. 2019 Feb 5;93(4):e01916-18. doi: 10.1128/JVI.01916-18. Print 2019 Feb 15. J Virol. 2019. PMID: 30463970 Free PMC article.
-
Semi-continuous Propagation of Influenza A Virus and Its Defective Interfering Particles: Analyzing the Dynamic Competition To Select Candidates for Antiviral Therapy.J Virol. 2021 Nov 23;95(24):e0117421. doi: 10.1128/JVI.01174-21. Epub 2021 Sep 22. J Virol. 2021. PMID: 34550771 Free PMC article.
-
Screening methods for influenza antiviral drug discovery.Expert Opin Drug Discov. 2012 May;7(5):429-38. doi: 10.1517/17460441.2012.674510. Epub 2012 Mar 22. Expert Opin Drug Discov. 2012. PMID: 22435452 Review.
-
Targeting the host or the virus: current and novel concepts for antiviral approaches against influenza virus infection.Antiviral Res. 2012 Dec;96(3):391-404. doi: 10.1016/j.antiviral.2012.09.013. Epub 2012 Sep 26. Antiviral Res. 2012. PMID: 23022351 Free PMC article. Review.
Cited by
-
Investigating Different Mechanisms of Action in Combination Therapy for Influenza.Front Pharmacol. 2018 Oct 23;9:1207. doi: 10.3389/fphar.2018.01207. eCollection 2018. Front Pharmacol. 2018. PMID: 30405419 Free PMC article.
-
Analysis of Practical Identifiability of a Viral Infection Model.PLoS One. 2016 Dec 30;11(12):e0167568. doi: 10.1371/journal.pone.0167568. eCollection 2016. PLoS One. 2016. PMID: 28036339 Free PMC article.
-
Advancing therapies for viral infections using mechanistic computational models of the dynamic interplay between the virus and host immune response.Curr Opin Virol. 2021 Oct;50:103-109. doi: 10.1016/j.coviro.2021.07.007. Epub 2021 Aug 24. Curr Opin Virol. 2021. PMID: 34450519 Free PMC article. Review.
-
Mathematical modeling of plus-strand RNA virus replication to identify broad-spectrum antiviral treatment strategies.PLoS Comput Biol. 2023 Apr 4;19(4):e1010423. doi: 10.1371/journal.pcbi.1010423. eCollection 2023 Apr. PLoS Comput Biol. 2023. PMID: 37014904 Free PMC article.
-
Mammalian adaptation risk in HPAI H5N8: a comprehensive model bridging experimental data with mathematical insights.Emerg Microbes Infect. 2024 Dec;13(1):2339949. doi: 10.1080/22221751.2024.2339949. Epub 2024 Apr 16. Emerg Microbes Infect. 2024. PMID: 38572657 Free PMC article.
References
-
- WHO (2009) Influenza fact sheet No 211.
-
- Center for Disease Control and Prevention (2012) Influenza Antiviral Medications: A Summary for Clinicians.
MeSH terms
Substances
LinkOut - more resources
Full Text Sources
Other Literature Sources
Medical
