

A process similar to autophagy is associated with cytocidal chloroquine resistance in Plasmodium falciparum
- PMID: 24278114
- PMCID: PMC3835802
- DOI: 10.1371/journal.pone.0079059
A process similar to autophagy is associated with cytocidal chloroquine resistance in Plasmodium falciparum
Abstract
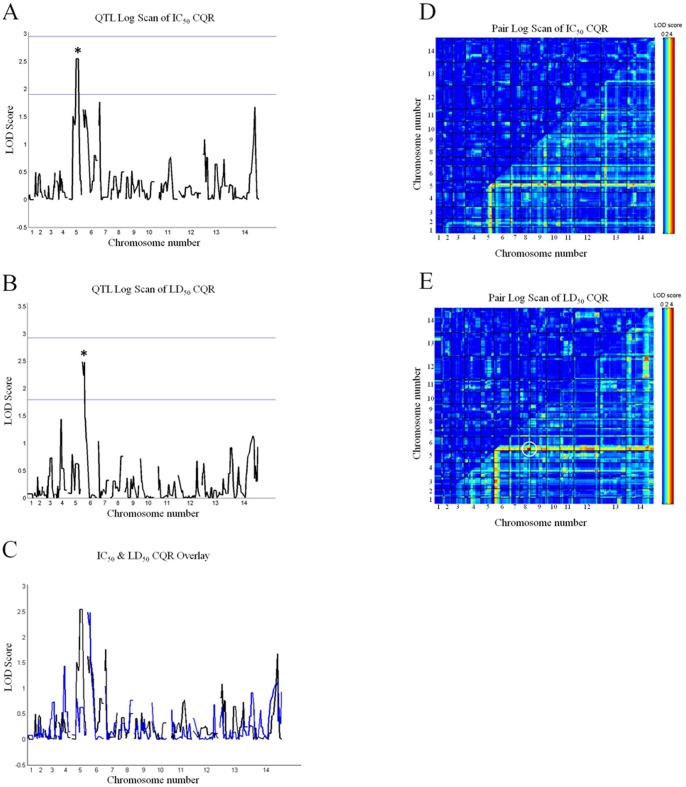
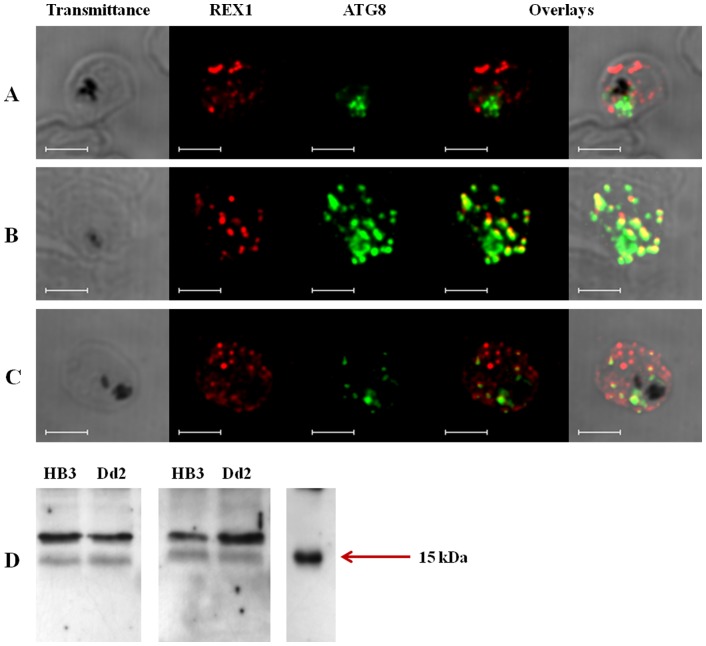
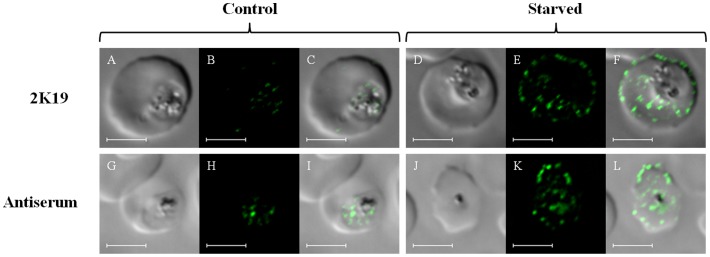
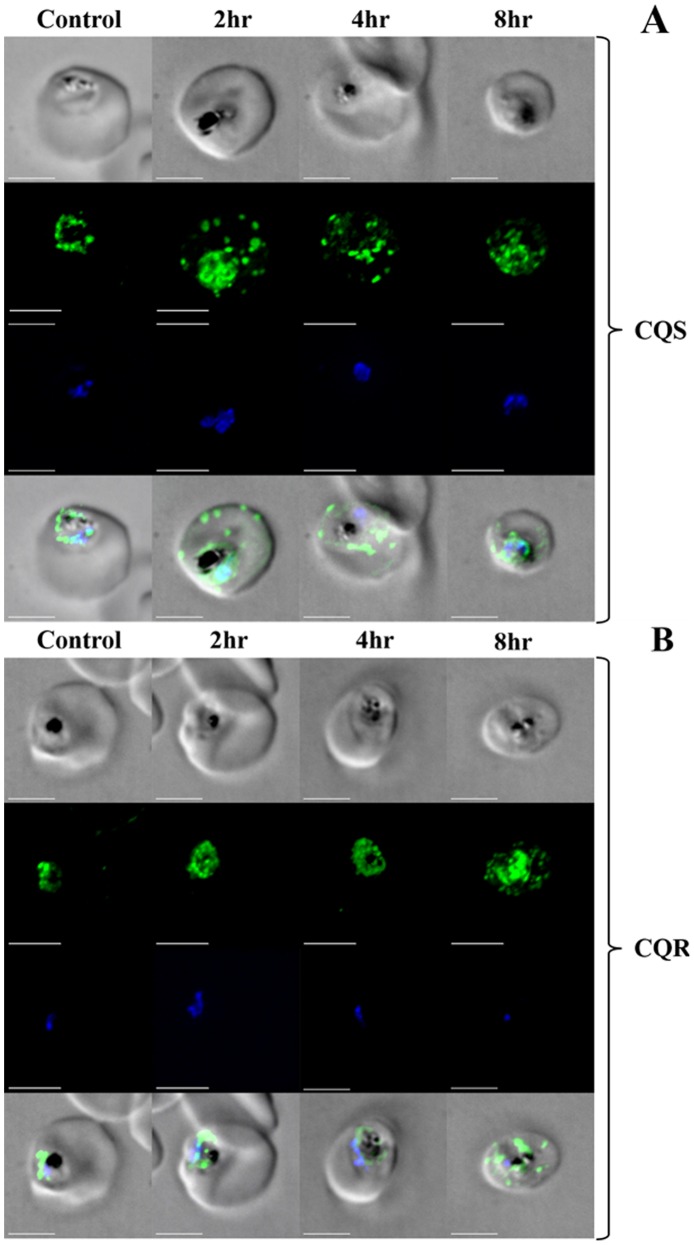
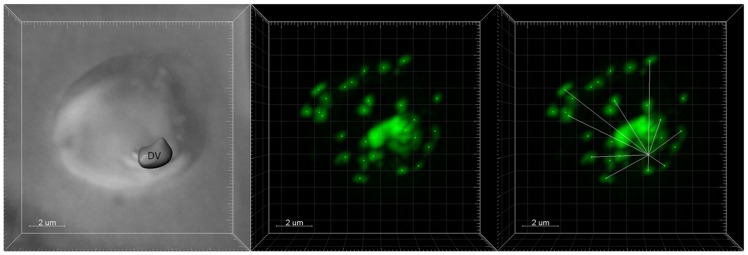
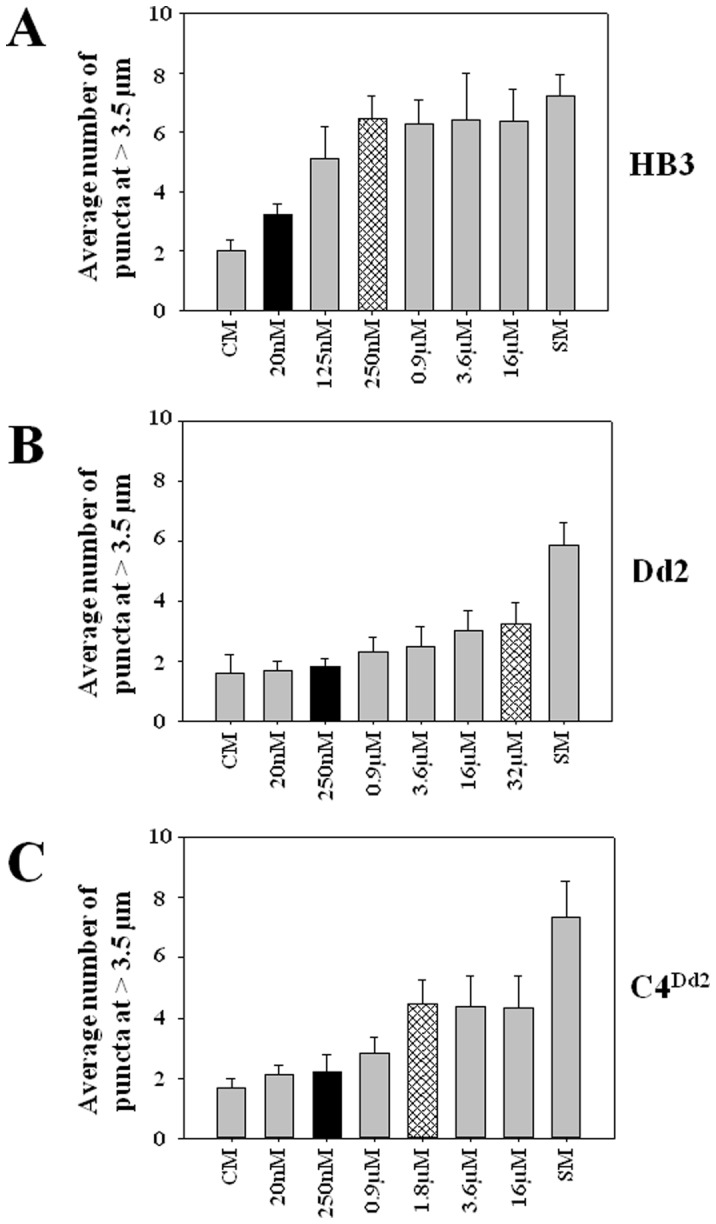
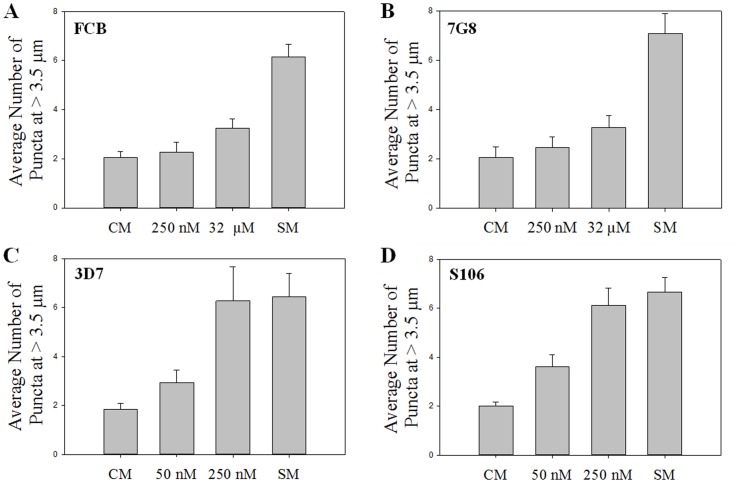
Resistance to the cytostatic activity of the antimalarial drug chloroquine (CQ) is becoming well understood, however, resistance to cytocidal effects of CQ is largely unexplored. We find that PfCRT mutations that almost fully recapitulate P. falciparum cytostatic CQ resistance (CQR(CS)) as quantified by CQ IC50 shift, account for only 10-20% of cytocidal CQR (CQR(CC)) as quantified by CQ LD50 shift. Quantitative trait loci (QTL) analysis of the progeny of a chloroquine sensitive (CQS; strain HB3)×chloroquine resistant (CQR; strain Dd2) genetic cross identifies distinct genetic architectures for CQR(CS) vs CQR(CC) phenotypes, including identification of novel interacting chromosomal loci that influence CQ LD50. Candidate genes in these loci are consistent with a role for autophagy in CQR(CC), leading us to directly examine the autophagy pathway in intraerythrocytic CQR parasites. Indirect immunofluorescence of RBC infected with synchronized CQS vs CQR trophozoite stage parasites reveals differences in the distribution of the autophagy marker protein PfATG8 coinciding with CQR(CC). Taken together, the data show that an unusual autophagy-like process is either activated or inhibited for intraerythrocytic trophozoite parasites at LD50 doses (but not IC50 doses) of CQ, that the pathway is altered in CQR P. falciparum, and that it may contribute along with mutations in PfCRT to confer the CQR(CC) phenotype.
Conflict of interest statement
Figures
Similar articles
-
Functional characteristics of the malaria parasite's "chloroquine resistance transporter": implications for chemotherapy.Virulence. 2010 Jul-Aug;1(4):304-8. doi: 10.4161/viru.1.4.12012. Virulence. 2010. PMID: 21178460
-
Chloroquine susceptibility and reversibility in a Plasmodium falciparum genetic cross.Mol Microbiol. 2010 Nov;78(3):770-87. doi: 10.1111/j.1365-2958.2010.07366.x. Epub 2010 Sep 29. Mol Microbiol. 2010. PMID: 20807203 Free PMC article.
-
Chloroquine transport in Plasmodium falciparum. 1. Influx and efflux kinetics for live trophozoite parasites using a novel fluorescent chloroquine probe.Biochemistry. 2009 Oct 13;48(40):9471-81. doi: 10.1021/bi901034r. Biochemistry. 2009. PMID: 19728740 Free PMC article.
-
pfcrt is more than the Plasmodium falciparum chloroquine resistance gene: a functional and evolutionary perspective.Acta Trop. 2005 Jun;94(3):170-80. doi: 10.1016/j.actatropica.2005.04.004. Acta Trop. 2005. PMID: 15866507 Review.
-
Current understanding of the molecular basis of chloroquine-resistance in Plasmodium falciparum.J Postgrad Med. 2006 Oct-Dec;52(4):271-6. J Postgrad Med. 2006. PMID: 17102545 Review.
Cited by
-
High-throughput matrix screening identifies synergistic and antagonistic antimalarial drug combinations.Sci Rep. 2015 Sep 25;5:13891. doi: 10.1038/srep13891. Sci Rep. 2015. PMID: 26403635 Free PMC article.
-
Artemisinin-Based Antimalarial Drug Therapy: Molecular Pharmacology and Evolving Resistance.Trop Med Infect Dis. 2019 Jun 4;4(2):89. doi: 10.3390/tropicalmed4020089. Trop Med Infect Dis. 2019. PMID: 31167396 Free PMC article. Review.
-
Artemisinin-Based Drugs Target the Plasmodium falciparum Heme Detoxification Pathway.Antimicrob Agents Chemother. 2021 Mar 18;65(4):e02137-20. doi: 10.1128/AAC.02137-20. Print 2021 Mar 18. Antimicrob Agents Chemother. 2021. PMID: 33495226 Free PMC article.
-
Autophagy in the control and pathogenesis of parasitic infections.Cell Biosci. 2020 Sep 5;10:101. doi: 10.1186/s13578-020-00464-6. eCollection 2020. Cell Biosci. 2020. PMID: 32944216 Free PMC article. Review.
-
Chloroquine exposure triggers distinct cellular responses in sensitive versus resistant Plasmodium falciparum parasites.Sci Rep. 2018 Jul 24;8(1):11137. doi: 10.1038/s41598-018-29422-6. Sci Rep. 2018. PMID: 30042399 Free PMC article.
References
-
- Plowe CV, Cortese JF, Djimde A, Nwanyanwu OC, Watkins WM, et al. (1997) Mutations in Plasmodium falciparum dihydrofolate reductase and dihydropteroate synthase and epidemiologic patterns of pyrimethamine-sulfadoxine use and resistance. J Infect Dis. 176: 1590–1596. - PubMed
-
- Wang P, Read M, Sims PF, Hyde JE (1997) Sulfadoxine resistance in the human malaria parasite Plasmodium falciparum is determined by mutations in dihydropteroate synthetase and an additional factor associated with folate utilization. Mol Microbiol. 23: 979–86. - PubMed
Publication types
MeSH terms
Substances
Grants and funding
LinkOut - more resources
Full Text Sources
Other Literature Sources
