. 2013 Nov 22;8(11):e79763.
doi: 10.1371/journal.pone.0079763. eCollection 2013.

A celiac cellular phenotype, with altered LPP sub-cellular distribution, is inducible in controls by the toxic gliadin peptide P31-43

Affiliations

A celiac cellular phenotype, with altered LPP sub-cellular distribution, is inducible in controls by the toxic gliadin peptide P31-43

Merlin Nanayakkara et al. PLoS One. .

Abstract

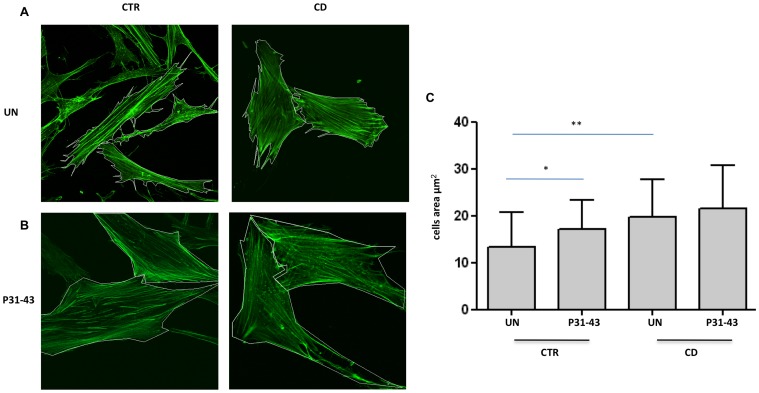
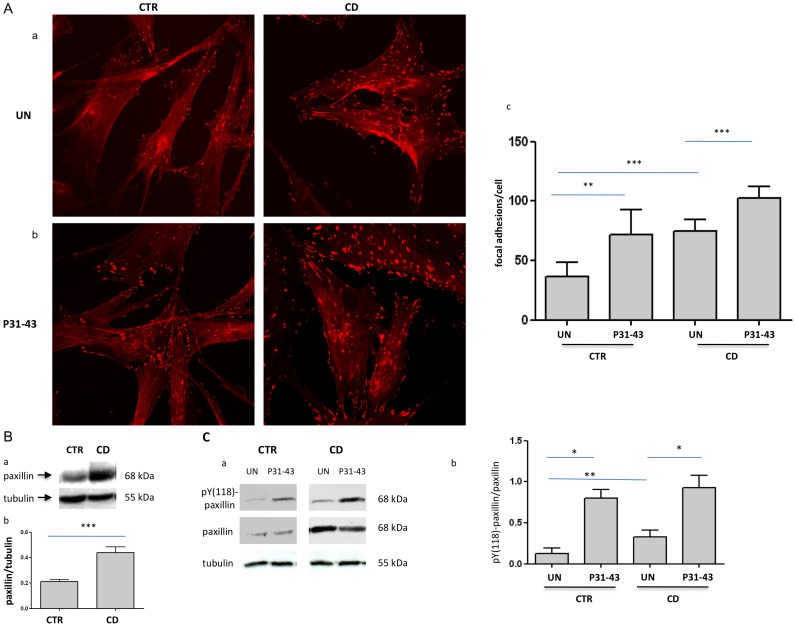
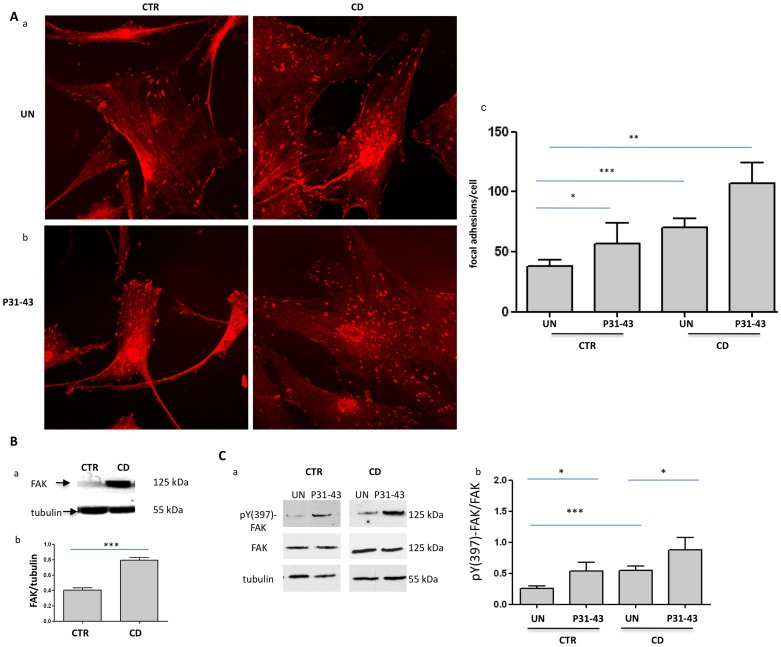
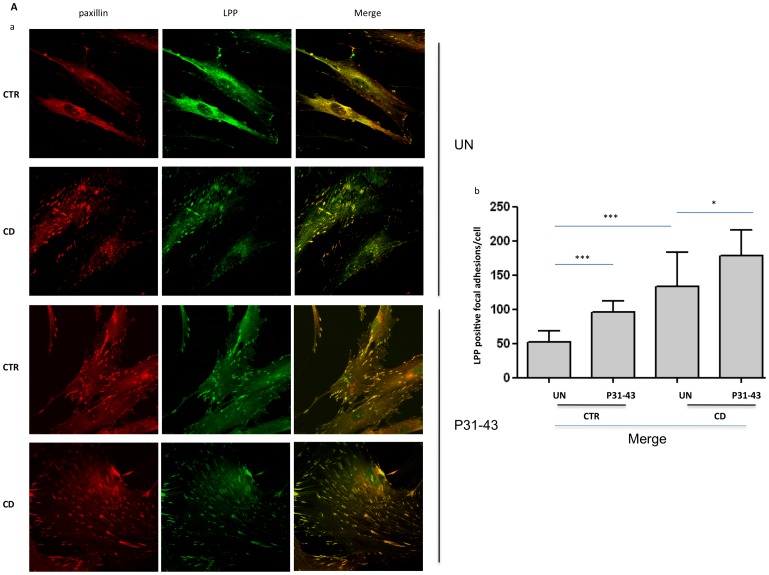
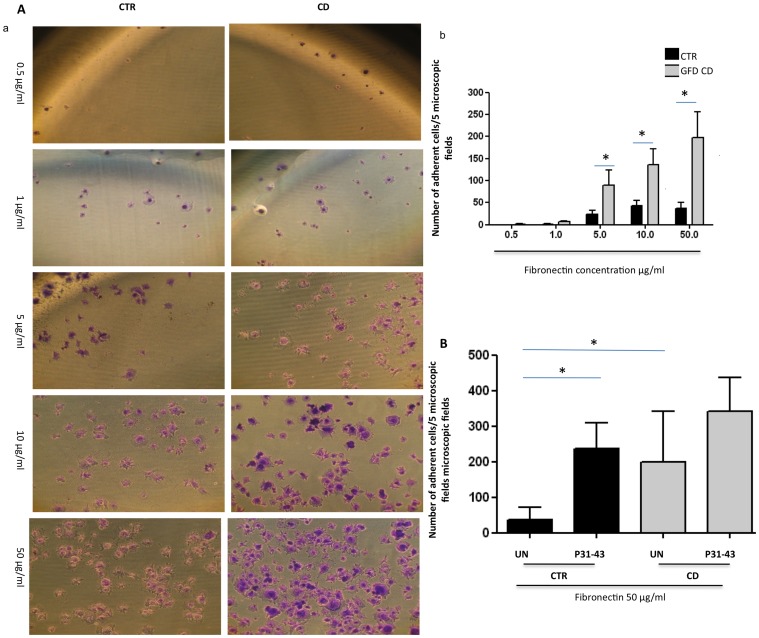
Celiac disease (CD) is a frequent inflammatory intestinal disease, with a genetic background, caused by gliadin-containing food. Undigested gliadin peptides P31-43 and P57-68 induce innate and adaptive T cell-mediated immune responses, respectively. Alterations in the cell shape and actin cytoskeleton are present in celiac enterocytes, and gliadin peptides induce actin rearrangements in both the CD mucosa and cell lines. Cell shape is maintained by the actin cytoskeleton and focal adhesions, sites of membrane attachment to the extracellular matrix. The locus of the human Lipoma Preferred Partner (LPP) gene was identified as strongly associated with CD using genome-wide association studies (GWAS). The LPP protein plays an important role in focal adhesion architecture and acts as a transcription factor in the nucleus. In this study, we examined the hypothesis that a constitutive alteration of the cell shape and the cytoskeleton, involving LPP, occurs in a cell compartment far from the main inflammation site in CD fibroblasts from skin explants. We analyzed the cell shape, actin organization, focal adhesion number, focal adhesion proteins, LPP sub-cellular distribution and adhesion to fibronectin of fibroblasts obtained from CD patients on a Gluten-Free Diet (GFD) and controls, without and with treatment with A-gliadin peptide P31-43. We observed a "CD cellular phenotype" in these fibroblasts, characterized by an altered cell shape and actin organization, increased number of focal adhesions, and altered intracellular LPP protein distribution. The treatment of controls fibroblasts with gliadin peptide P31-43 mimics the CD cellular phenotype regarding the cell shape, adhesion capacity, focal adhesion number and LPP sub-cellular distribution, suggesting a close association between these alterations and CD pathogenesis.


Conflict of interest statement

Competing Interests: The authors have declared that no competing interests exist.

Figures

Figure 1
Figure 1. Cell shape and area of fibroblasts from CD patients and controls before and after P31-43 treatment.
A. Cell shape and area are altered in fibroblasts from CD patients with respect to controls (CTR). Confocal immunofluorescence images of fibroblasts from CD patients and controls stained with Phalloidin-FITC to highlight F-actin. White lines identify the cell area. Representative fields. B. Treatment with P31-43 alters the shape and area of control fibroblasts. Confocal immunofluorescence images of fibroblasts from CD patients and controls treated with P31-43 for 30 min and stained with Phalloidin-FITC to highlight F-actin. White lines identify the cell area. Representative fields. C. Statistical analysis of 30 fibroblasts from several fields of 3 independent experiments from 6 patients and 6 controls. The area of the cells was analyzed using LSM-Zeiss confocal software. Columns represent the means, and the bars represent the standard deviation of the fibroblasts area. The area of the cells was analyzed using LSM-Zeiss confocal software. Columns represent the means, and the bars represent the standard deviation. Student's t-test. * = p<0.05; ** = p<0.01.
Figure 2
Figure 2. Analysis of the focal adhesion number and paxillin protein levels in CD and controls fibroblasts before and after P31-43 treatment.
A. Increase of the focal adhesion number in CD, as revealed through paxillin staining before and after P31-43 treatment. a) Confocal immunofluorescence images of fibroblasts from CD patients and controls stained with antibodies against paxillin. Representative fields. b) Confocal immunofluorescence images of fibroblasts stained with antibodies against paxillin from CD patients and controls treated with P31-43 for 30 min. Representative fields. c) Statistical analysis of the number of paxillin-positive focal adhesions per cell before and after P31-43 treatment. Focal adhesions of 30 fibroblasts of several fields from 3 independent experiments from 6 patients and 6 controls were counted. Columns represent the means, and the bars represent the standard deviations. Student's t-test. ** = p<0.01; *** = p<0.001. B. Paxillin protein levels are increased in fibroblasts from CD patients with respect to controls. a) Western blot analysis of fibroblast protein lysates from controls and CD patients. The upper line is stained for paxillin, and the lower line is stained for tubulin. Representative experiment. b) Densitometric analysis of western blots stained for paxillin in fibroblasts from 6 CD patients and 6 controls. Paxillin levels were normalized to the tubulin levels. Columns represent the means, and the bars represent the standard deviation. Student's t-test. *** = p<0.001. C. Paxillin phopshorylation is increased in CD fibroblasts and is further increased after P31-43 treatment for 30′. a) Western blot analysis of fibroblast protein lysates from controls and CD patients. The upper line is stained for pY-paxillin, the middle line is stained for paxillin, and the lower line is stained for tubulin. Representative experiment. b) Densitometric analysis of western blots stained for pY-paxillin and paxillin in fibroblasts from 5 CD patients and 5 controls. pY-paxillin levels were normalized to the paxillin levels. Columns represent the means, and the bars represent the standard deviation. Student's t-test. * = p<0.05; ** = p<0.01.
Figure 3
Figure 3. Analysis of the focal adhesion number and FAK levels in CD and controls fibroblasts before and after P31-43 treatment.
A. Increase of focal adhesion number in CD, as revealed through FAK staining before and after P31-43 treatment. a) Confocal immunofluorescence images of fibroblasts from CD patients and controls stained with antibodies against FAK. Representative fields. b) Confocal immunofluorescence images of fibroblasts stained with antibodies against FAK from CD patients and controls treated with P31-43 for 30 min. Representative fields. c) Statistical analysis of the number of FAK-positive focal adhesions per cell before and after P31-43 treatment. Focal adhesions of 30 fibroblasts of several fields from 3 independent experiments with 6 patients and 6 controls were counted. Columns represent the means, and the bars represent the standard deviations. Student's t-test. * = p<0.05; ** = p<0.01; *** = p<0.001. B. FAK protein levels are increased in fibroblasts from CD patients with respect to the controls. a) Western blot analysis of fibroblast protein lysates from controls and CD patients. The upper line is stained for FAK, and the lower line is stained for tubulin. Representative experiment. b) Densitometric analysis of western blots stained for FAK in fibroblasts from 5 CD patients and 5 controls. FAK levels were normalized to the tubulin levels. Columns represent the means, and the bars represent the standard deviations. Student's t-test. *** = p<0.001. C. FAK phopshorylation is increased in CD fibroblasts and is further increased after P31-43 treatment for 30′. a) Western blot analysis of fibroblasts proteins lysates from controls and CD patients treated or not with P31-43. The upper line is stained for pY-FAK, the middle line is stained for FAK and the lower line is stained for tubulin. Representative experiment. b) Densitometric analysis of western blots stained for pY-FAK and FAK in fibroblasts from 5 CD patients and 5 controls. pY-FAK levels were normalized to the FAK levels. Columns represent the means, and the bars represent the standard deviation. Student's t-test. * = p<0.05; *** = p<0.001.
Figure 4
Figure 4. Analysis of LPP levels and sub-cellular distribution in CD and controls fibroblasts before and after P31-43 treatment.
A. Increased focal adhesion localization of LPP in CD fibroblasts with respect to controls, as revealed through paxillin co-staining. a) Confocal immunofluorescence images of fibroblasts from CD patients and controls treated or not with P31-43 for 30 min and stained with antibodies against paxillin (red) and LPP (green); the merge of the red and green fields is shown in yellow. Representative fields. b) Statistical analysis of the number of LPP/paxillin-merged positive focal adhesions per cell. Focal adhesions of 30 fibroblasts from several fields from 3 independent experiments with 5 patients and 5 controls were counted. Columns represent the means, and the bars represent the standard deviations. Student's t-test. * = p<0.05;*** = p<0.001. B. LPP protein levels were not increased in the fibroblasts from CD patients with respect to the controls and did not vary after 24 h treatment with P31-43. a) Western blot analysis of fibroblasts protein lysates from controls and CD patients treated or not with P31-43. The upper line was stained for LPP, and the lower line was stained for tubulin. Representative experiment. b) Densitometric analysis of western blots stained for LPP in fibroblasts from 5 CD patients and 5 controls treated or not with P31-43. LPP levels were normalized to tubulin levels. Columns represent the means, and the bars represent the standard deviations. Student's t-test. C. Decreased localization of LPP in the nuclear fraction of CD fibroblasts. a) Western blot analysis of LPP after separating the nuclear and cytosolic protein fractions. The upper lines were stained for LPP, and the lower lines were stained for tubulin and lamin A/C, which were used as loading controls for the cytosol and nuclear fractions, respectively. Representative experiment. b) Densitometric analysis of western blots stained for LPP in fibroblasts from 5 CD patients and 5 controls. The LPP levels were normalized in each protein fractions to the loading controls. Columns represent the means, and the bars represent the standard deviation. Student's t-test. * = p<0.05; ** = p<0.01.
Figure 5
Figure 5. Fibronectin adhesion of CD fibroblasts respect to controls.
A. CD fibroblasts adhered more than controls to fibronectin. a) Transmitted light images of crystal violet stained fibroblasts from CD patients and controls, seeded for 1 h on increasing concentrations of fibronectin, as indicated. Representative fields. b) Statistical analysis of the number of adherent fibroblasts from CD patients and controls seeded on different concentrations of fibronectin, as indicated. For each fibronectin concentration, the fibroblasts of 5 fields from 3 independent experiments with 5 patients and 5 controls were counted. Columns represent the means, and the bars represent the standard deviations. Student's t-test. * = p<0.01. B. P31-43 increased adhesion to fibronectin. Statistical analysis of the number of adherent fibroblasts from CD patients and controls seeded on 50 µg of fibronectin after P31-43 treatment for 1 h. Fibroblasts in 5 fields from 3 independent experiments with 5 patients and 5 controls were counted. Columns represent the means, and the bars represent the standard deviations. Student's t-test.

References

    1. Sollid LM (2000) Molecular basis of celiac disease. Annu Rev Immunol 18: 53–81. - PubMed
    1. Maiuri L, Ciacci C, Ricciardelli I, Vacca L, Raia V, et al. (2003) Association between innate response to gliadin and activation of pathogenic T cells in coeliac disease. Lancet 362: 30–37. - PubMed
    1. Hüe S, Mention JJ, Monteiro RC, Zhang S, Cellier C, et al. (2004) A direct role for NKG2D/MICA interaction in villous atrophy during celiac disease,. Immunity 21: 367–377. - PubMed
    1. Barone MV, Gimigliano A, Castoria G, Paolella G, Maurano F, et al. (2007) Growth factor-like activity of gliadin, an alimentary protein: implications for coeliac disease. Gut 56: 480–488. - PMC - PubMed
    1. Barone MV, Nanayakkara M, Paolella G, Maglio M, Vitale V, et al. (2010) Gliadin peptide P31-43 localises to endocytic vesicles and interferes with their maturation. PloS One 5: e12246. - PMC - PubMed

Publication types