. 2013 Nov 21;8(11):e79870.
doi: 10.1371/journal.pone.0079870. eCollection 2013.

Non-transferrin-bound iron (NTBI) uptake by T lymphocytes: evidence for the selective acquisition of oligomeric ferric citrate species

Affiliations

Non-transferrin-bound iron (NTBI) uptake by T lymphocytes: evidence for the selective acquisition of oligomeric ferric citrate species

Joao Arezes et al. PLoS One. .

Abstract

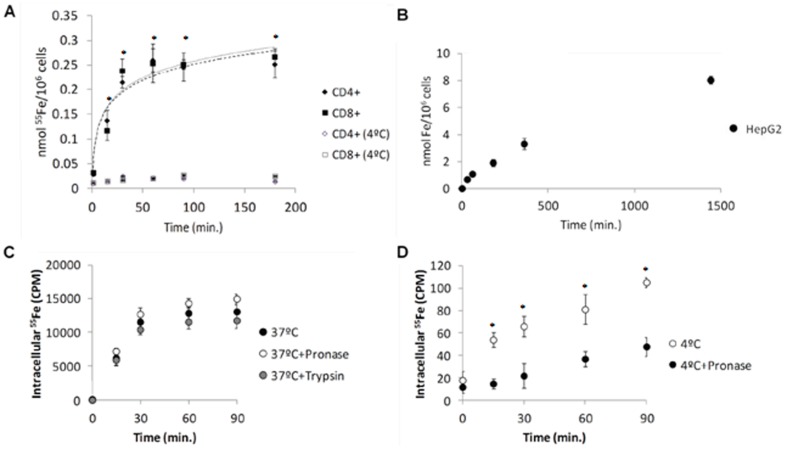
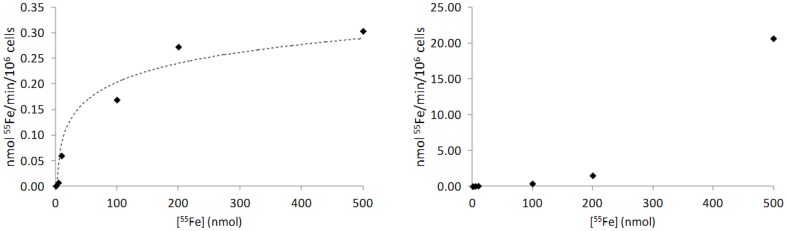
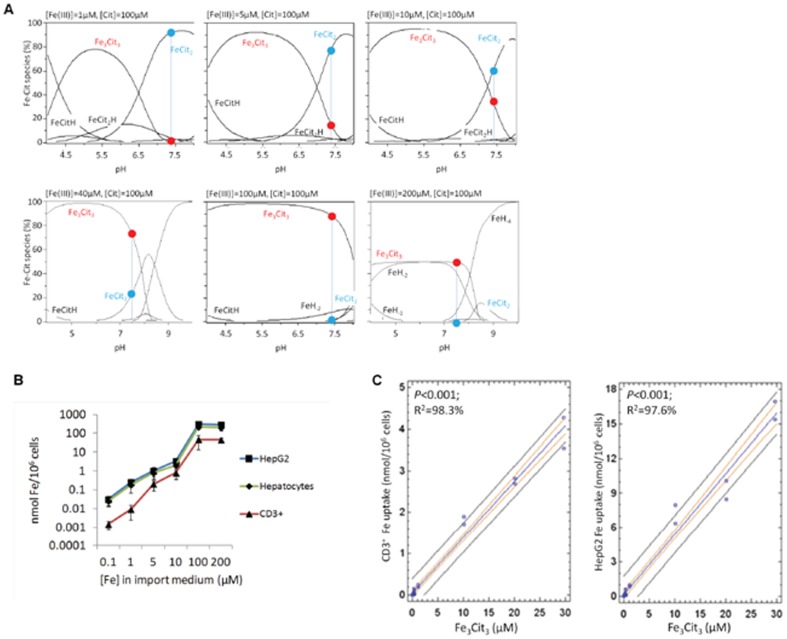
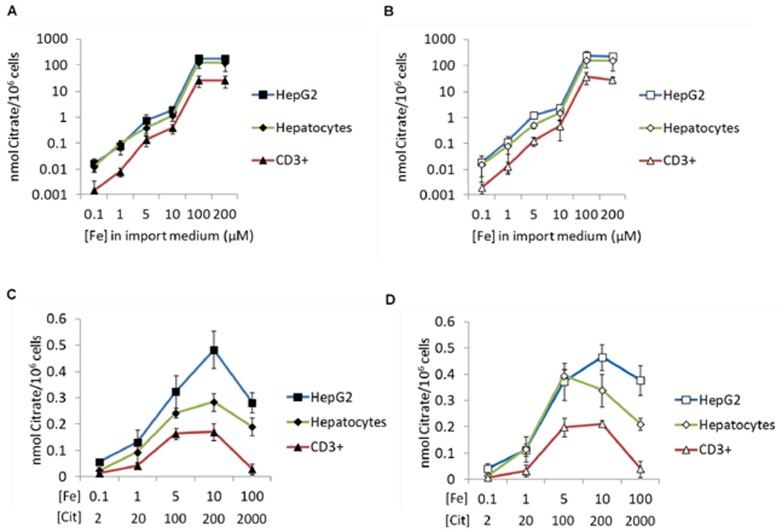
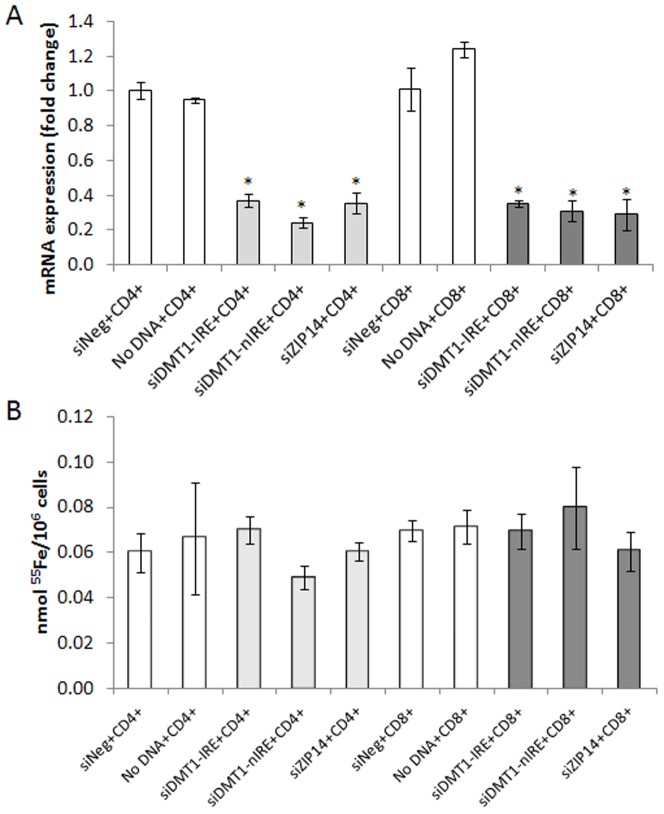
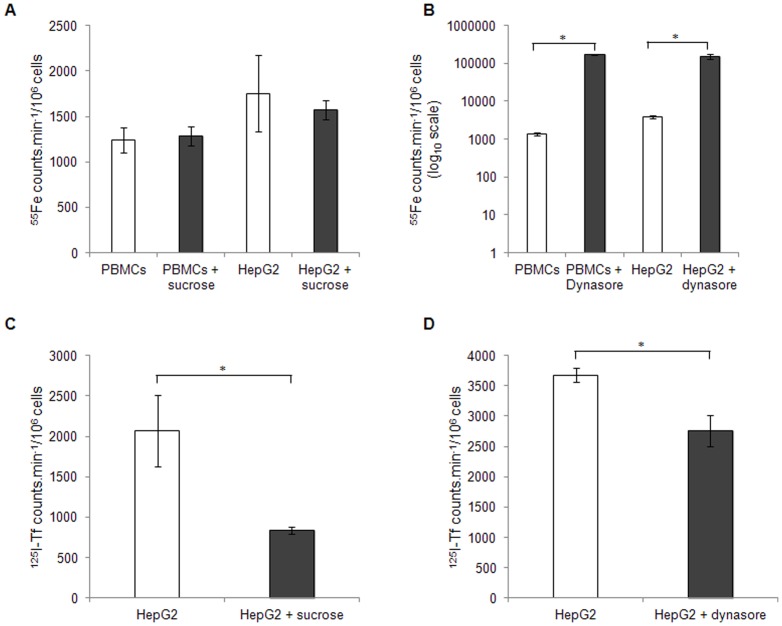
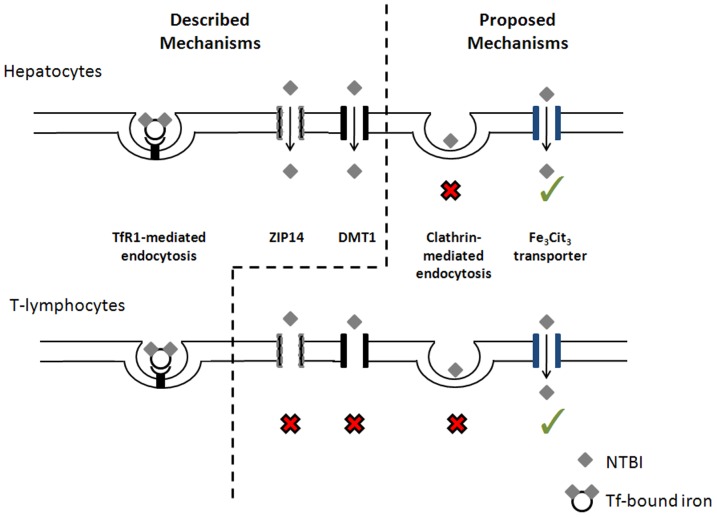
Iron is an essential nutrient in several biological processes such as oxygen transport, DNA replication and erythropoiesis. Plasma iron normally circulates bound to transferrin. In iron overload disorders, however, iron concentrations exceed transferrin binding capacity and iron appears complexed with low molecular weight molecules, known as non-transferrin-bound iron (NTBI). NTBI is responsible for the toxicity associated with iron-overload pathologies but the mechanisms leading to NTBI uptake are not fully understood. Here we show for the first time that T lymphocytes are able to take up and accumulate NTBI in a manner that resembles that of hepatocytes. Moreover, we show that both hepatocytes and T lymphocytes take up the oligomeric Fe3Cit3 preferentially to other iron-citrate species, suggesting the existence of a selective NTBI carrier. These results provide a tool for the identification of the still elusive ferric-citrate cellular carrier and may also open a new pathway towards the design of more efficient iron chelators for the treatment of iron overload disorders.


Conflict of interest statement

Competing Interests: The authors have declared that no competing interests exist.

Figures

Figure 1
Figure 1. Similar patterns of NTBI uptake by T lymphocytes and hepatocytes.
(A) NTBI uptake by human T-lymphocytes. CD4+ and CD8+ human T-lymphocytes were incubated with 5 µM of 55Fe-citrate (5∶100) at 37°C and 4°C and intracellular iron quantified at each time-point. Each point = average (n≥3) ±1SD. (B) NTBI uptake by HepG2 cells. HepG2 cells were incubated with 5 µM of 55Fe-citrate (5∶100) for up to 24 hours, at 37°C. Cell-associated 55Fe levels at each time point were measured. Each point is a mean value (n = 6) ± SD. Both T-lymphocytes and HepG2 cells are able to accumulate NTBI presenting a high rate of uptake during the first 30 minutes of incubation (C–D) Specificity of NTBI uptake. CD3+ cells were incubated with 5 µM of 55Fe-citrate (5∶100) for up to 90 min, at 37°C (C) or 4°C (D), and at each time point washed either with PBS (with or without pronase) or incubated for 15 min with serum-free RPMI with trypsin. Cell-associated 55Fe levels at each time point were measured. Each point is a mean value (n = 3) ± SD. The similar results obtained at 37°C together with the differences at 4°C suggest that most of the measured iron is intracellular. Statistical significance between samples at 37°C and controls at 4°C is indicated by * symbols (*p<0.01).
Figure 2
Figure 2. Kinetics of NTBI uptake in T lymphocytes and hepatocytes.
NTBI uptake by human T lymphocytes (A) and HepG2 cells (B). Cells were incubated with different concentrations of 55Fe-citrate (1 µM, 5 µM, 10 µM, 100 µM, 200 µM and 500 µM) at 37°C and intracellular iron quantified at various time points (0, 15, 30, 60 and 120 min) (n = 3). The values obtained during the first 30 min of incubation, when the transport system is not saturated, were used to calculate the rate of uptake for each concentration. CD3+ cells reach saturation at 200 µM of Fe-citrate and present a maximum rate of 0.4 nmol/min/106 cells, as opposite to HepG2 cells, which do not saturate even at 500 µM and present a faster rate of uptake (21 nmol/min/106 cells).
Figure 3
Figure 3. NTBI uptake by T-lymphocytes.
Silver sulfide autometallography coupled with Transmission Electron Microscopy was performed in CD3+ T lymphocytes incubated with 5 µM of Fe-citrate (5∶100) for 15, 30 or 60 minutes. Mock control cells were incubated without Fe-citrate for 60 minutes. Arrows signal silver grains corresponding to Fe-positive particles that can be visible in the cytoplasm of cell incubated with Fe-citrate as opposite to mock control cells in which it is only associated with the plasma membrane. Highest intensity was obtained at 30 min incubation. C = cytoplasm; PM = plasma membrane; N = nucleus. Bars = 200 nm.
Figure 4
Figure 4. Fe uptake by T lymphocytes and hepatocytes correlates with [Fe3Cit3].
(A) Speciation plots for Fe-citrate species were calculated for Fe∶citrate ratios from 1∶100–200∶100 using the Hyperquad simulation and speciation (HySS) program. Predicted relative abundance (%) of the two most common Fe-citrate species, at pH 7.4, is marked by a blue vertical line and a red (Fe3Cit3) or blue (FeCit2) dot. (B) Fe uptake by T lymphocytes and hepatocytes incubated with different iron∶citrate ratios increases with the relative abundance of Fe3Cit3. Experiments were performed at least three times with three replicates per experiment. Each point represents the mean (n = 3) ±1SD. (C) Regression analysis showing a significant correlation between Fe uptake by CD3+ (left) and HepG2 (right) cells with predicted [Fe3Cit3] concentration at pH 7.4.
Figure 5
Figure 5. Fe uptake by T lymphocytes and hepatocytes does not correlate with [FeCit2].
(A) Speciation plots for Fe-citrate species, calculated for increasing Fe-citrate concentrations maintaining a constant Fe∶citrate ratio of 1∶20 using the Hyperquad simulation and speciation (HySS) program. Predicted relative abundance (%) of the two most common Fe-Cit species at pH 7.4 is marked by a blue vertical line and a red (Fe3Cit3) or blue (FeCit2) dot. (B) Fe uptake by CD3+ lymphocytes and HepG2 cells in the presence of increasing Fe-citrate concentrations, maintaining a constant Fe∶citrate ratio of 1∶20 (same conditions as in panel A). Experiments were performed at least three times with three replicates per experiment. Each point represents the mean (n = 3) ±1SD. (C) Regression analysis showing no significant correlation between Fe uptake by CD3+ (left) and HepG2 (right) cells with predicted [FeCit2] concentration at pH 7.4.
Figure 6
Figure 6. Uptake of citrate reflects the cell membrane binding capacity of each Fe-citrate species.
Cells were incubated for 30∶citrate ratios and then treated with pronase. 14C-citrate radioactivity was measured in the cell lysates (intracellular fraction; A and C) and in the supernatants (membrane fraction; B and D). (A–B) Citrate uptake (A) and cell membrane-binding (B) by HepG2, hepatocytes and CD3+ lymphocytes in conditions of predicted increase of Fe3Cit3. (C–D) Citrate uptake (C) and cell membrane-binding (D) in the presence of increasing Fe-citrate concentrations, maintaining a constant Fe∶citrate ratio of 1∶20. Each point represents the mean (n = 3) ±1SD.
Figure 7
Figure 7. Involvement of NTBI transporters in Ferric citrate uptake by T lymphocytes.
mRNA levels (A; qRT-PCR) and corresponding NTBI uptake (B) by CD4+ and CD8+ T lymphocytes following nucleofection with siRNAs specific for ZIP14, DMT1-IRE and DMT1-nIRE, with scrambled siRNAs (siNeg) or with no DNA as controls. Each column represents the mean value (n = 3) ± SD. Statistical significance between samples (grey columns) and controls (white columns) is indicated by * symbols (*p<0.01). No differences in Fe∶citrate uptake were observed after silencing DMT1 or ZIP14.
Figure 8
Figure 8. Involvement of clathrin-mediated endocytosis in NTBI uptake by PBMCs and HepG2 cells.
(A–B) 55Fe uptake by PBMCs and HepG2 cells in the presence of 0.45M of sucrose (A) or 80 µM of Dynasore (B) to inhibit clathrin-mediated endocytosis, after incubation with 5 µM of 55Fe-citrate (5∶100) at 37°C (C–D) 125I-Transferrin internalization in the presence of 0.45M of sucrose (C) or 80 µM of Dynasore (D). Each bar represents a mean value (n = 3) ± SD. Statistical significance is indicated by * symbols (*p<0.01). The inhibition of these pathways did not prevent the uptake of NTBI in both PBMCs and HepG2 cells but transferrin internalization was decreased.
Figure 9
Figure 9. Iron uptake by T lymphocytes and hepatocytes.
Transferrin-bound iron is internalized by TFR1-mediated endocytosis in hepatocytes and T-lymphocytes . Non-transferrin-bound iron (NTBI) is taken up by hepatocytes via Zrt- and Irt-like Protein 14 (ZIP14, Slc39A14; after ferric reductase-mediated reduction of Fe3+ to Fe2+) , . Divalent metal transporter 1 (DMT1) was the first described NTBI (Fe2+) transporter , although recent data suggests it may not be important for the iron loading of the hepatocyte . We hypothesize that ZIP14 and DMT1 are not involved in the uptake of ferric citrate by T lymphocytes (red×symbols). Clathrin-mediated endocytosis of ferric citrate does not occur in hepatocytes and T lymphocytes (red×symbols). T lymphocytes and hepatocytes selectively take up the oligomer Fe3Cit3, which suggests the existence of a specific transporter (green symbols).

References

    1. Hentze MW, Muckenthaler MU, Galy B, Camaschella C (2010) Two to tango: regulation of Mammalian iron metabolism. Cell 142: 24–38. - PubMed
    1. Breuer W, Hershko C, Cabantchik ZI (2000) The importance of non-transferrin bound iron in disorders of iron metabolism. Transfus Sci 23: 185–192. - PubMed
    1. Esposito BP, Breuer W, Sirankapracha P, Pootrakul P, Hershko C, et al. (2003) Labile plasma iron in iron overload: redox activity and susceptibility to chelation. Blood 102: 2670–2677. - PubMed
    1. Zimelman AP, Zimmerman HJ, McLean R, Weintraub LR (1977) Effect of iron saturation of transferrin on hepatic iron uptake: an in vitro study. Gastroenterology 72: 129–131. - PubMed
    1. Brissot P, Wright TL, Ma WL, Weisiger RA (1985) Efficient clearance of non-transferrin-bound iron by rat liver. Implications for hepatic iron loading in iron overload states. J Clin Invest 76: 1463–1470. - PMC - PubMed

Publication types