

Complex network analysis of CA3 transcriptome reveals pathogenic and compensatory pathways in refractory temporal lobe epilepsy
- PMID: 24278214
- PMCID: PMC3836787
- DOI: 10.1371/journal.pone.0079913
Complex network analysis of CA3 transcriptome reveals pathogenic and compensatory pathways in refractory temporal lobe epilepsy
Erratum in
- PLoS One. 2014;9(1). doi:10.1371/annotation/e9e55996-408c-4660-a0ae-a3597b16f986
Abstract
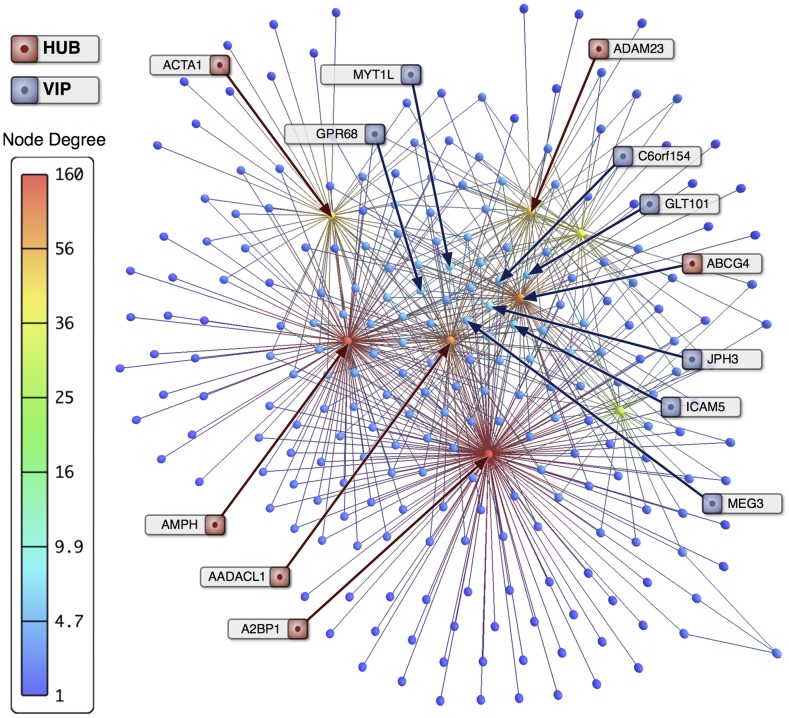
We previously described - studying transcriptional signatures of hippocampal CA3 explants - that febrile (FS) and afebrile (NFS) forms of refractory mesial temporal lobe epilepsy constitute two distinct genomic phenotypes. That network analysis was based on a limited number (hundreds) of differentially expressed genes (DE networks) among a large set of valid transcripts (close to two tens of thousands). Here we developed a methodology for complex network visualization (3D) and analysis that allows the categorization of network nodes according to distinct hierarchical levels of gene-gene connections (node degree) and of interconnection between node neighbors (concentric node degree). Hubs are highly connected nodes, VIPs have low node degree but connect only with hubs, and high-hubs have VIP status and high overall number of connections. Studying the whole set of CA3 valid transcripts we: i) obtained complete transcriptional networks (CO) for FS and NFS phenotypic groups; ii) examined how CO and DE networks are related; iii) characterized genomic and molecular mechanisms underlying FS and NFS phenotypes, identifying potential novel targets for therapeutic interventions. We found that: i) DE hubs and VIPs are evenly distributed inside the CO networks; ii) most DE hubs and VIPs are related to synaptic transmission and neuronal excitability whereas most CO hubs, VIPs and high hubs are related to neuronal differentiation, homeostasis and neuroprotection, indicating compensatory mechanisms. Complex network visualization and analysis is a useful tool for systems biology approaches to multifactorial diseases. Network centrality observed for hubs, VIPs and high hubs of CO networks, is consistent with the network disease model, where a group of nodes whose perturbation leads to a disease phenotype occupies a central position in the network. Conceivably, the chance for exerting therapeutic effects through the modulation of particular genes will be higher if these genes are highly interconnected in transcriptional networks.
Conflict of interest statement
Figures
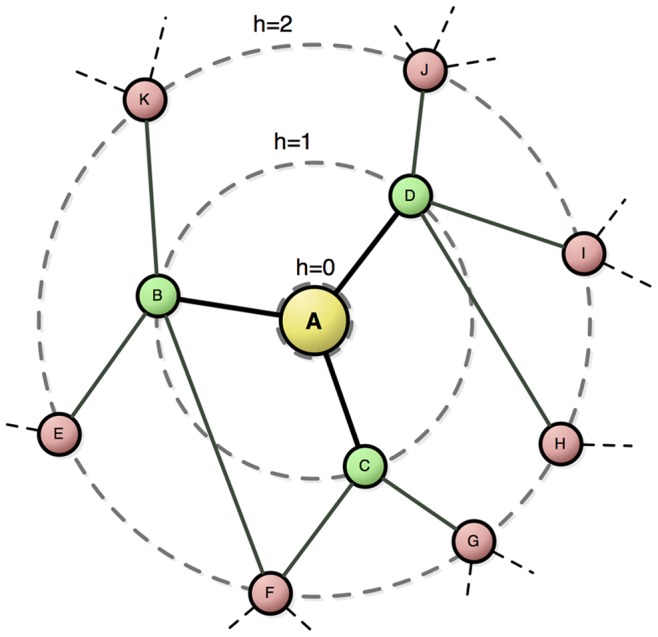
 as reference (i.e. centered at node
  ). Each concentric level is represented by rings
  , namely
  ,
,  and
and  , with concentric node degrees
  and
and  .
.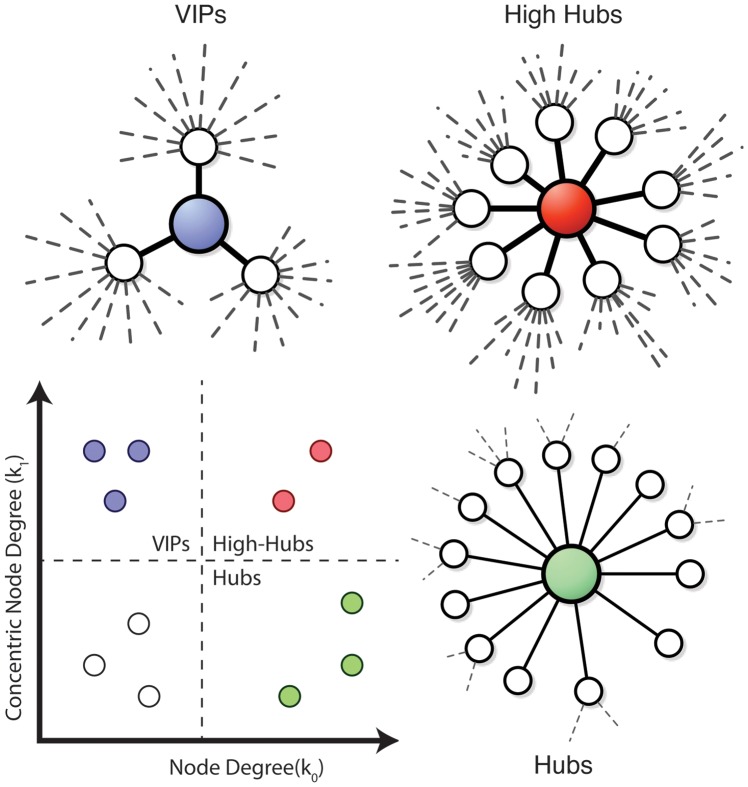
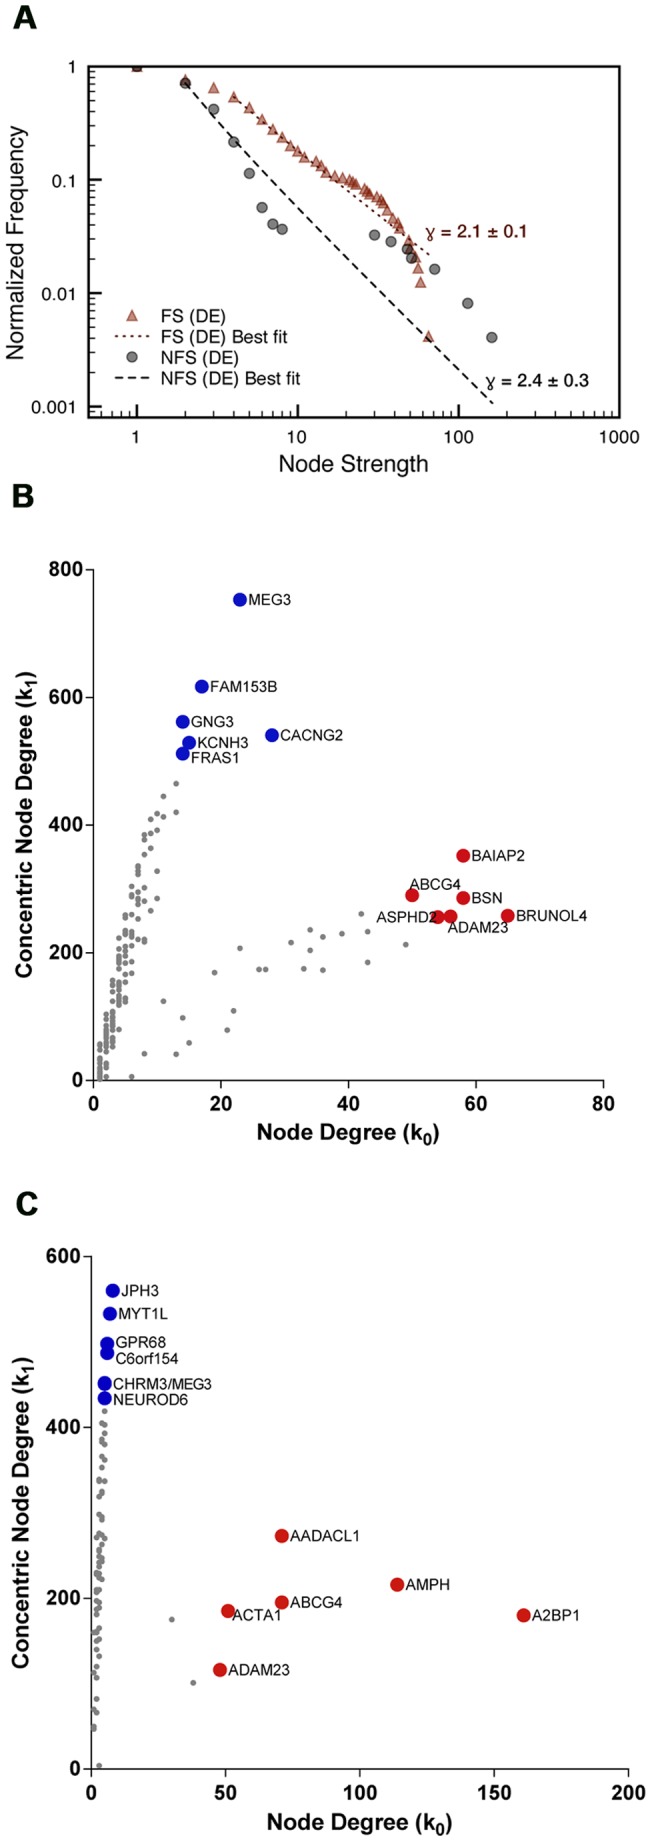
 . Scatter plot (B,C) of node degree (
 ) vs concentric node degree (
 ) measures of GO annotated genes obtained in the networks for differentially expressed genes (DE). Hubs (red) and VIPs (blue) genes are identified by their gene symbols. 240 nodes for the FS network (B) and 246 nodes for the NFS network (C).
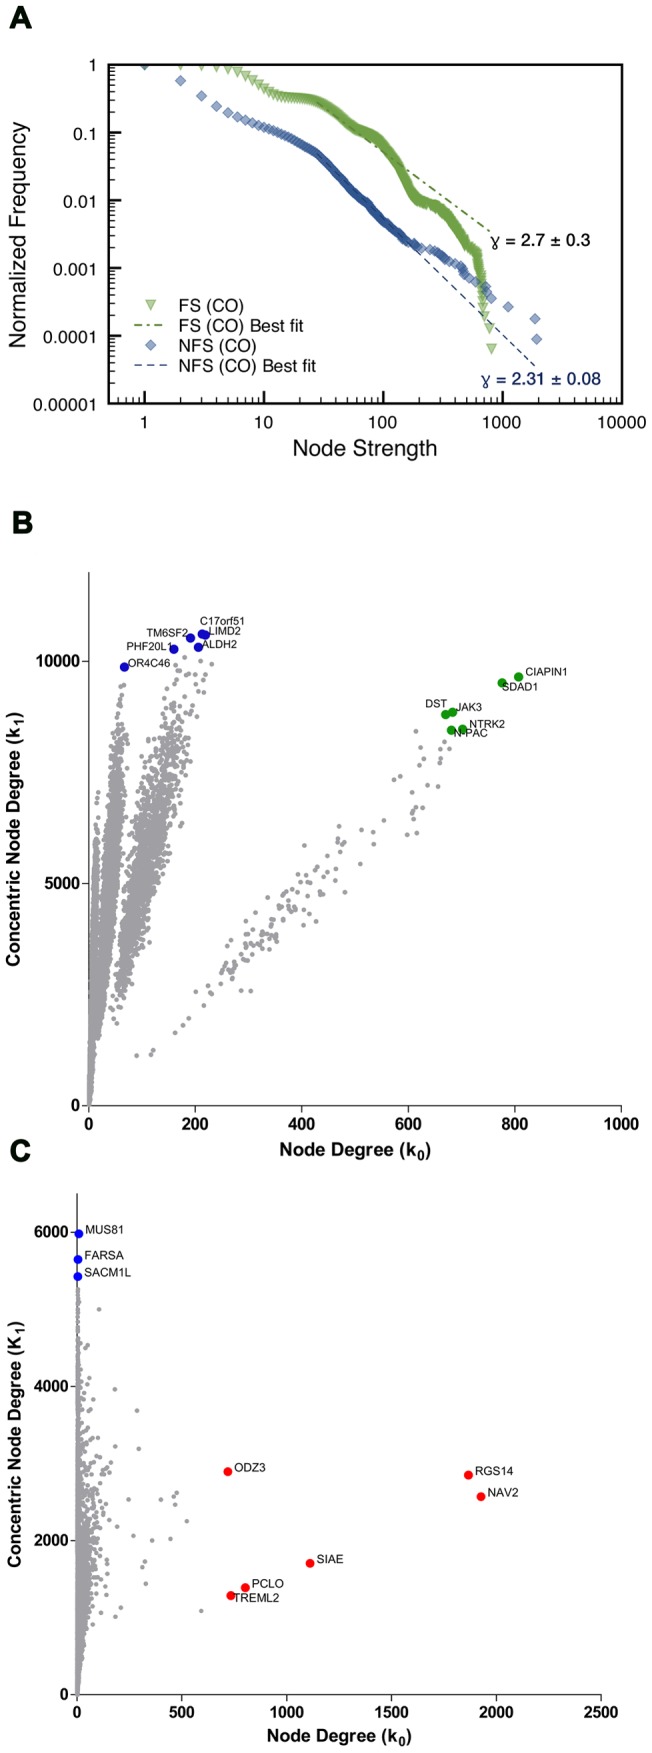
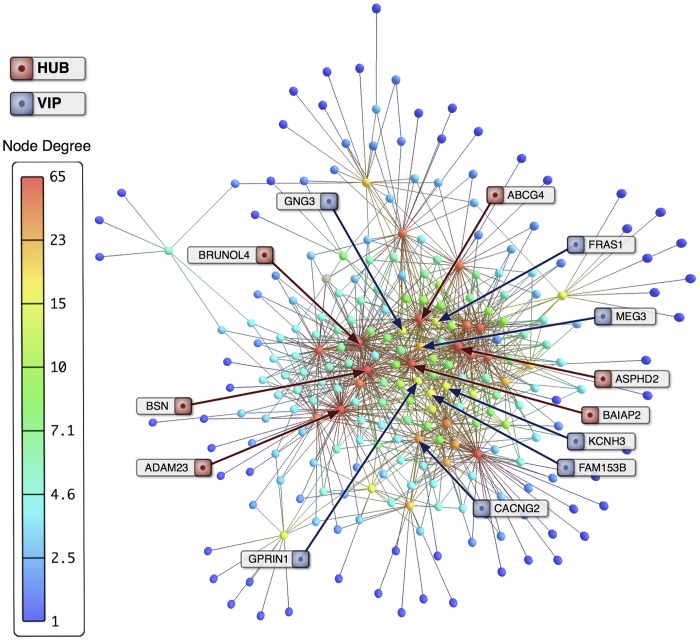
 . Scatter plot (B,C) of node degree (
 ) vs concentric node degree (
 ) measures of GO annotated genes obtained in the complete transcriptional interaction networks (CO). High-Hubs (green), Hubs (red) and Vips (blue) genes are identified by their gene symbols.15,585 nodes for the FS network (B) and 11,233 nodes for the NFS network (C).
References
-
- Carpio A, Hauser WA (2009) Epilepsy in the developing world. Curr Neurol Neurosci Rep 9: 319–326. - PubMed
-
- Hemming K, Maguire MJ, Hutton JL, Marson AG (2013) Vigabatrin for refractory partial epilepsy. Cochrane Database Syst Rev 1: CD007302. - PubMed
-
- Engel J (2001) Mesial temporal lobe epilepsy: what have we learned? The Neuroscientist 7: 340–352. - PubMed
Publication types
MeSH terms
Substances
LinkOut - more resources
Full Text Sources
Other Literature Sources
Molecular Biology Databases
Miscellaneous
