. 2013 Nov 21;8(11):e80269.
doi: 10.1371/journal.pone.0080269. eCollection 2013.

Non-invasive in vivo imaging of near infrared-labeled transferrin in breast cancer cells and tumors using fluorescence lifetime FRET

Affiliations

Non-invasive in vivo imaging of near infrared-labeled transferrin in breast cancer cells and tumors using fluorescence lifetime FRET

Ken Abe et al. PLoS One. .

Abstract

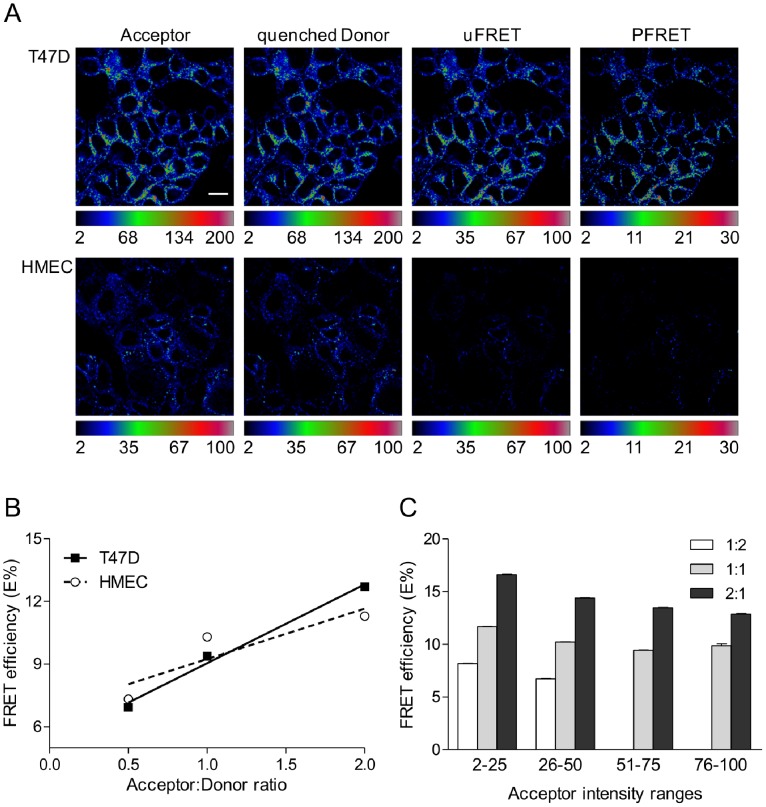
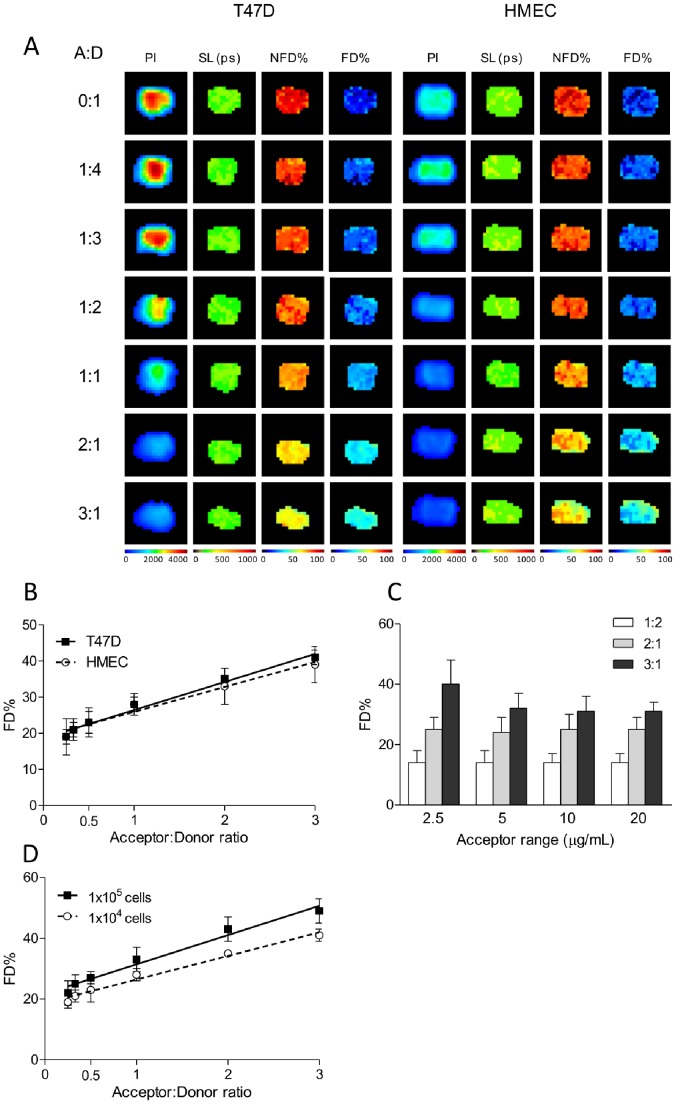
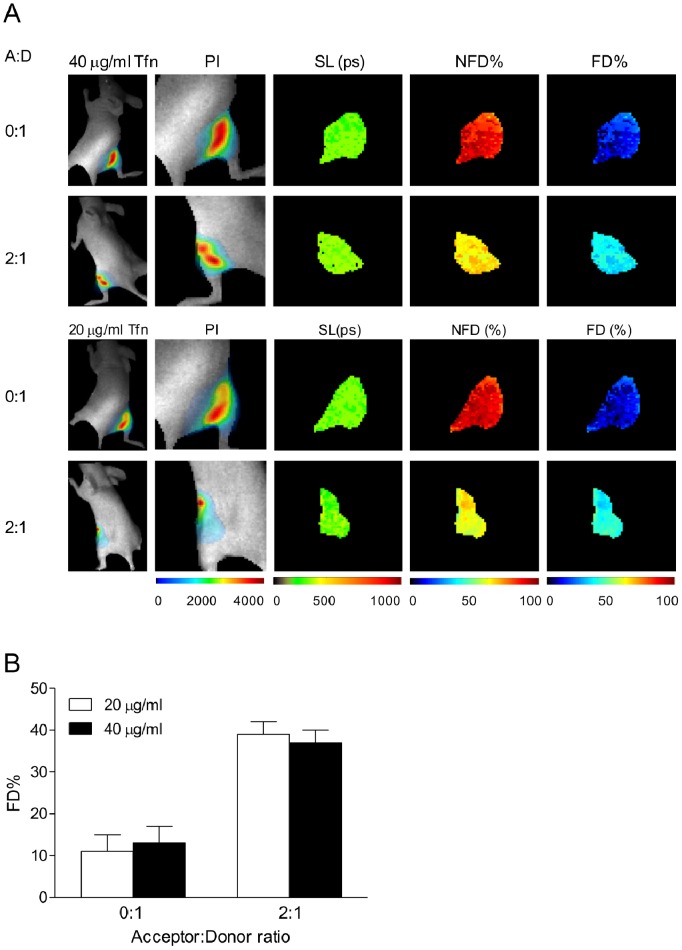
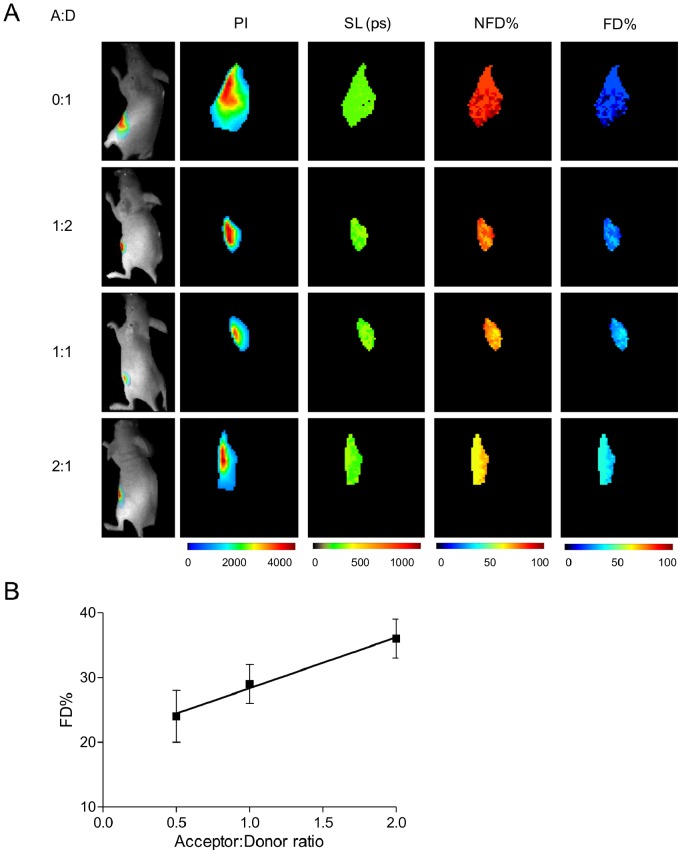
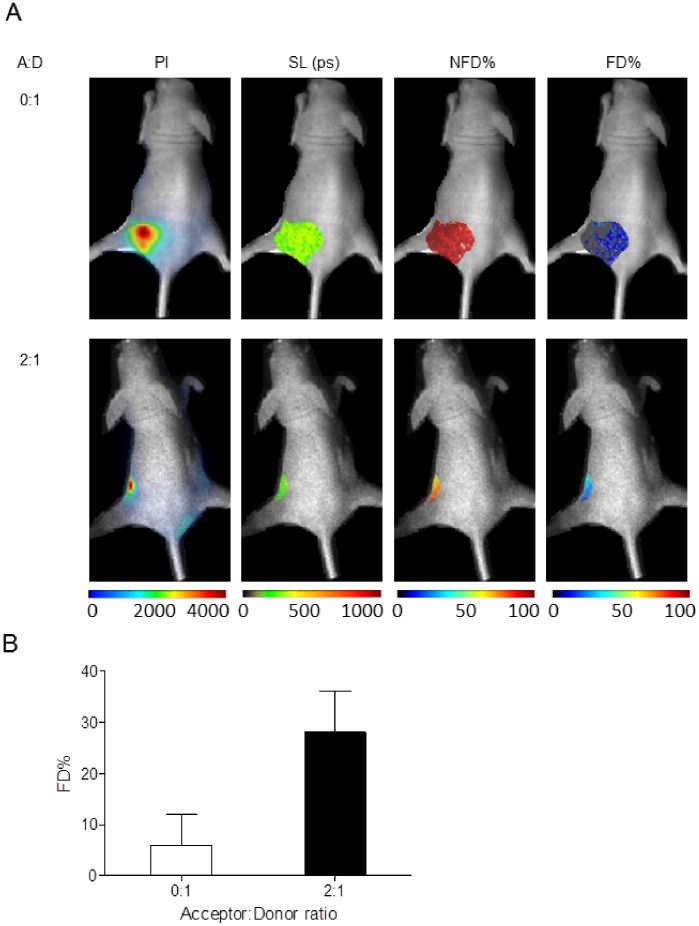
The conjugation of anti-cancer drugs to endogenous ligands has proven to be an effective strategy to enhance their pharmacological selectivity and delivery towards neoplasic tissues. Since cell proliferation has a strong requirement for iron, cancer cells express high levels of transferrin receptors (TfnR), making its ligand, transferrin (Tfn), of great interest as a delivery agent for therapeutics. However, a critical gap exists in the ability to non-invasively determine whether drugs conjugated to Tfn are internalized into target cells in vivo. Due to the enhanced permeability and retention (EPR) effect, it remains unknown whether these Tfn-conjugated drugs are specifically internalized into cancer cells or are localized non-specifically as a result of a generalized accumulation of macromolecules near tumors. By exploiting the dimeric nature of the TfnR that binds two molecules of Tfn in close proximity, we utilized a Förster Resonance Energy Transfer (FRET) based technique that can discriminate bound and internalized Tfn from free, soluble Tfn. In order to non-invasively visualize intracellular amounts of Tfn in tumors through live animal tissues, we developed a novel near infrared (NIR) fluorescence lifetime FRET imaging technique that uses an active wide-field time gated illumination platform. In summary, we report that the NIR fluorescence lifetime FRET technique is capable of non-invasively detecting bound and internalized forms of Tfn in cancer cells and tumors within a live small animal model, and that our results are quantitatively consistent when compared to well-established intensity-based FRET microscopy methods used in in vitro experiments.


Conflict of interest statement

Competing Interests: The authors have declared that no competing interests exist.

Figures

Figure 1
Figure 1. Characterization of Tfn-Tfn-R complexes in normal vs. cancer cells using intensity-based confocal microscopy FRET.
Tfn-TfnR FRET assay shows similar behavior in T47D breast cancer cells and HMECs. (A) T47D breast cancer cells have significantly more uptake of AF488-Tfn and AF555-Tfn compared to HMECs, as shown in both the acceptor (AF555) and quenched donor (AF488) channels. Pseudocolor images of acceptor, quenched donor, uncorrected FRET (uFRET) and corrected FRET (PFRET) show the typical endocytic pattern of irregular and punctate structures. PFRET images confirm the existence of energy transfer between endogenous Tfn-AF488 (donor) and Tfn-AF555 (acceptor) in intracellular punctate endocytic structures. Scale bar = 20 µm. (B) E% is calculated and plotted against internalized A:D ratios of 1∶2, 1∶1, and 2∶1 in T47D and HMECs. Despite lower FRET signal in HMECs, a trend for higher E% relative to increasing A:D ratios is clearly seen in both HMECs and T47D cells. (C) E% is plotted against binned acceptor intensity levels. As A:D ratios increase, E% increases. Statistical analysis of this relationship is shown in Table S1 in File S1. However, within each A:D ratio, E% is independent of acceptor intensity levels in T47D cells (Table S2 in File S1). Together with the trend shown in (B), these patterns support a pattern consistent with a clustered organization of TfnR-Tfn complexes rather than random interactions. Error bars indicate 95% confidence interval.
Figure 2
Figure 2. NIR fluorescence lifetime FRET of TfnR-Tfn complexes in normal vs. cancer cells using time-domain, wide-field macroscopic imaging in vitro.
Fluorescence lifetime analysis of TfnR-Tfn complexes using NIR FRET pair AF700–AF750 and a time-domain, wide-field macroscopic imaging system. (A) T47D (left panels) and HMECs (right panels) were internalized with AF700-Tfn (donor) or AF750-Tfn (acceptor) in increasing A:D ratios of 0∶1, 1∶4, 1∶3, 1∶2, 1∶1, 2∶1, and 3∶1 in a 96-well format. The first column on the left indicates the pixel intensity (PI) of donor fluorophores (AF700-Tfn) and the subsequent decrease in intensity as the ratio of acceptor molecules (AF750-Tfn) increase due to quenching. Short component lifetimes (SL) measured in picoseconds (ps) are shown in the second column, indicating a high sensitivity and uniform detection despite the heterogeneity of donor intensities in the sample (Table S3 in File S1). The columns on the left indicate the relative abundance of NFD populations and FD populations. Each image shows 20×20 pixels with 0.5 mm/pixel size. (B) Quantification of donors participating in FRET events are shown as %FD and show a positive relationship relative to increasing proportion of acceptor molecules in both T47D and HMECs (Table S4 in File S1). (C) The %FD in relation to acceptor levels show an independent relationship as seen in FRET results using visible FRET detected by confocal microscopy (Table S5 in File S1). (D) Sensitivity of FD% is consistent across 1×10⁵ to 1×10⁴ cells (Table S6 in File S1). PI = pixel intensity, SL = short lifetime, NFD% = non-FRET Donor%, FD% = FRET Donor%. Error bars indicate standard deviation.
Figure 3
Figure 3. NIR fluorescence lifetime FRET of TfnR-Tfn complexes in normal vs. cancer cells using wide-field macroscopic imaging in vivo.
Fluorescence lifetime FRET is detected between AF700-Tfn (donor) and AF750-Tfn (acceptor) in T47D cells within a live mouse. (A) Mice injected with ∼1.5×10⁶ T47D cells internalized with various ratios of NIR dyes conjugated to Tfn are shown. In the top two rows, donor AF700-Tfn is held constant at 40 µg/ml and imaged. Pixel intensity (PI) is shown on the first column on the left of the donor fluorophore. Short component lifetime (SL) of the donor dye (Table S7 in File S1) is uniform among a varied intensity of donor dye. The next two columns on the right show the population of non-FRET donor (NFD) and FRET-donor (FD), respectively, showing an increase upon introduction of the AF750-Tfn (acceptor). Similar results are shown with Tfn-AF700 (donor) at 20 µg/ml. Each image shows 60×60 pixels with 0.5 mm/pixel size. (B) Results of the FD% show similar results between the two amounts, and also showing similar increases in FD in relation to the addition of AF750-Tfn acceptor (Tables S8–S10 in File S1). Error bars indicate standard deviation. PI = pixel intensity, SL = short lifetime, NFD% = non-FRET Donor%, FD% = FRET Donor%.
Figure 4
Figure 4. Accuracy of fluorescence lifetime FRET using NIR fluorophores in vivo.
Decreased fluorescence lifetime due to FRET is detectable through living mice. (A) Mice are injected with matrigel resuspended ∼1×10⁶ cells pre-internalized with Tfn conjugated with NIR dyes at A:D ratios of donor only, 1∶2, 1∶1, and 2∶1 and imaged. Images show donor intensities on the left column followed by measurements of the short lifetime component (Table S11 in File S1), which also shows uniformity. The NFD and FD species are shown on the following columns to the right. Each image shows 60×60 pixels with 0.5 mm/pixel size. (B) Quantification of the FD% shows a robust linear increase in proportion to an increasing amount of AF750-Tfn (acceptor). These results indicate that the macroscopic imaging system employed is capable of determining FRET-mediated lifetime changes of donor fluorophores in cells through living animal tissues. Error bars indicate standard deviation.
Figure 5
Figure 5. NIR fluorescence lifetime FRET of TfnR-Tfn complexes in tumor xenografts using wide-field macroscopic imaging in vivo.
Detection of decreased fluorescence lifetime due to FRET is achieved within mouse tumor model. (A) Mice implanted with live T47D cells developed tumors after 4–6 weeks of growth. For FRET detection, mice were injected with Tfn conjugated with NIR dyes using A:D ratios of 0∶1 (upper row) or 2∶1 (lower row) and subjected to fluorescence lifetime FRET imaging 1 h post-injection. Panels from left to right show pixel intensity (PI), the short lifetime (SL) estimation and distribution, non-FRET donor % (NFD%) and FRET donor % (FD%). (B) Quantification of FD% indicates a higher proportion of FD% in the presence of acceptor NIR-Tfn, thus demonstrating the capability to detect FRET between AF700-Tfn and AF75-Tfn bound to homodimeric TfnR in tumors within a live mouse model.

References

    1. Maeda H (2012) Vascular permeability in cancer and infection as related to macromolecular drug delivery, with emphasis on the EPR effect for tumor-selective drug targeting. Proc Jpn Acad Ser B Phys Biol Sci 88: 53–71. - PMC - PubMed
    1. Prabhakar U, Maeda H, Jain RK, Sevick-Muraca EM, Zamboni W, et al. (2013) Challenges and key considerations of the enhanced permeability and retention effect for nanomedicine drug delivery in oncology. Cancer Res 73: 2412–2417. - PMC - PubMed
    1. Bartlett DW, Su H, Hildebrandt IJ, Weber WA, Davis ME (2007) Impact of tumor-specific targeting on the biodistribution and efficacy of siRNA nanoparticles measured by multimodality in vivo imaging. Proc Natl Acad Sci U S A 104: 15549–15554. - PMC - PubMed
    1. Barbet J, Bardies M, Bourgeois M, Chatal JF, Cherel M, et al. (2012) Radiolabeled antibodies for cancer imaging and therapy. Methods Mol Biol 907: 681–697. - PubMed
    1. Dijkers EC, Kosterink JG, Rademaker AP, Perk LR, van Dongen GA, et al. (2009) Development and characterization of clinical-grade 89Zr-trastuzumab for HER2/neu immunoPET imaging. J Nucl Med 50: 974–981. - PubMed

Publication types