. 2013 Nov 22;8(11):e80886.
doi: 10.1371/journal.pone.0080886. eCollection 2013.

High theta and low alpha powers may be indicative of BCI-illiteracy in motor imagery

Affiliations

High theta and low alpha powers may be indicative of BCI-illiteracy in motor imagery

Minkyu Ahn et al. PLoS One. .

Abstract

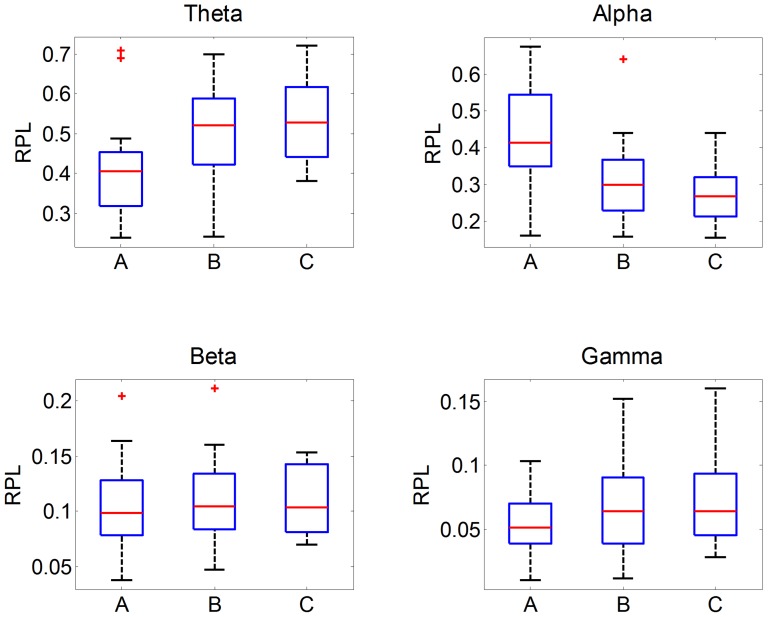
In most brain computer interface (BCI) systems, some target users have significant difficulty in using BCI systems. Such target users are called 'BCI-illiterate'. This phenomenon has been poorly investigated, and a clear understanding of the BCI-illiteracy mechanism or a solution to this problem has not been reported to date. In this study, we sought to demonstrate the neurophysiological differences between two groups (literate, illiterate) with a total of 52 subjects. We investigated recordings under non-task related state (NTS) which is collected during subject is relaxed with eyes open. We found that high theta and low alpha waves were noticeable in the BCI-illiterate relative to the BCI-literate people. Furthermore, these high theta and low alpha wave patterns were preserved across different mental states, such as NTS, resting before motor imagery (MI), and MI states, even though the spatial distribution of both BCI-illiterate and BCI-literate groups did not differ. From these findings, an effective strategy for pre-screening subjects for BCI illiteracy has been determined, and a performance factor that reflects potential user performance has been proposed using a simple combination of band powers. Our proposed performance factor gave an r = 0.59 (r(2) = 0.34) in a correlation analysis with BCI performance and yielded as much as r = 0.70 (r(2) = 0.50) when seven outliers were rejected during the evaluation of whole data (N = 61), including BCI competition datasets (N = 9). These findings may be directly applicable to online BCI systems.


Conflict of interest statement

Competing Interests: The authors have declared that no competing interests exist.

Figures

Figure 1
Figure 1. Procedure for one trial in an MI experiment.
Figure 2
Figure 2. Estimated performance by CSP and FLDA.
Subjects are assigned to groups ‘A’, ‘B’ or ‘C’ according to the accuracy of their performance.
Figure 3
Figure 3. The mean distribution of RPL over all channels for each band and each group.
This result is obtained from the NTS signal and whisker length , which is set to 1.5. The outliers (red crosses) are categorized on the basis of the whisker lengths. For results from statistical test, please see the section ‘Characteristics of NTS between BCI-literate and BCI-illiterate groups’.
Figure 4
Figure 4. Spatial distributions of RPL for NTS over various frequency bands.
The comparison of NTS (1st and 2nd rows), their differences (the 3rd row was calculated by subtracting group C from group A), and the result of a Wilcoxon rank-sum test (FDR corrected) between the 1st and 2nd rows (4th row)
Figure 5
Figure 5. Spatial patterns (group averaged) of RPL over three different mental states (NTS, REST and MI).
Figure 6
Figure 6. The result of correlation analysis between spectral band power and performance.
Upper row represents correlation coefficient and lower image shows corresponding p-value (FDR corrected) for four bands.
Figure 7
Figure 7. A group classification between BCI-literate (blue square) and BCI-illiterate (red circle) groups (Top left).
It is shown with the discriminant line that was obtained by FLDA. The group classification line was applied to the BCI competition dataset in the top right figure. These numbers indicate the kappa coefficients for each subject and the confusion matrices are noted on the bottom line.
Figure 8
Figure 8. The relationship between the proposed PPfactor and BCI accuracy.
The whole data points (N = 61) give a correlation value (PPfactor and BCI accuracy) of r = 0.59 (r2 = 0.35, P<1.0e-6). The association reaches up to r = 0.7 (r2 = 0.49, P<5.0e-9) when the rejection of seven outliers are applied. The regression line calculated from offline data excluding seven outliers is overlaid.

References

    1. Guger C, Edlinger G, Harkam W, Niedermayer I, Pfurtscheller G (2003) How many people are able to operate an EEG-based brain-computer interface (BCI)? IEEE Trans Neural Syst Rehabil Eng 11: 145–147 10.1109/TNSRE.2003.814481 - DOI - PubMed
    1. Guger C, Daban S, Sellers E, Holzner C, Krausz G, et al. (2009) How many people are able to control a P300-based brain-computer interface (BCI)? Neurosci Lett 462: 94–98 10.1016/j.neulet.2009.06.045 - DOI - PubMed
    1. Allison B, Luth T, Valbuena D, Teymourian A, Volosyak I, et al. (2010) BCI demographics: how many (and what kinds of) people can use an SSVEP BCI? IEEE Trans Neural Syst Rehabil Eng 18: 107–116 10.1109/TNSRE.2009.2039495 - DOI - PubMed
    1. Guger C (2011) State-of-the-Art in BCI Research: BCI Award 2010. In: Fazel R, editor. Recent Advances in Brain-Computer Interface Systems. InTech. Available: http://www.intechopen.com/books/howtoreference/recent-advances-in-brain-....
    1. Blankertz B, Sannelli C, Halder S, Hammer EM, Kübler A, et al. (2010) Neurophysiological predictor of SMR-based BCI performance. Neuroimage 51: 1303–1309 10.1016/j.neuroimage.2010.03.022 - DOI - PubMed

Publication types

LinkOut - more resources