. 2013 Nov 20;8(11):e80901.
doi: 10.1371/journal.pone.0080901. eCollection 2013.

Osmostress-induced cell volume loss delays yeast Hog1 signaling by limiting diffusion processes and by Hog1-specific effects

Affiliations

Osmostress-induced cell volume loss delays yeast Hog1 signaling by limiting diffusion processes and by Hog1-specific effects

Roja Babazadeh et al. PLoS One. .

Abstract

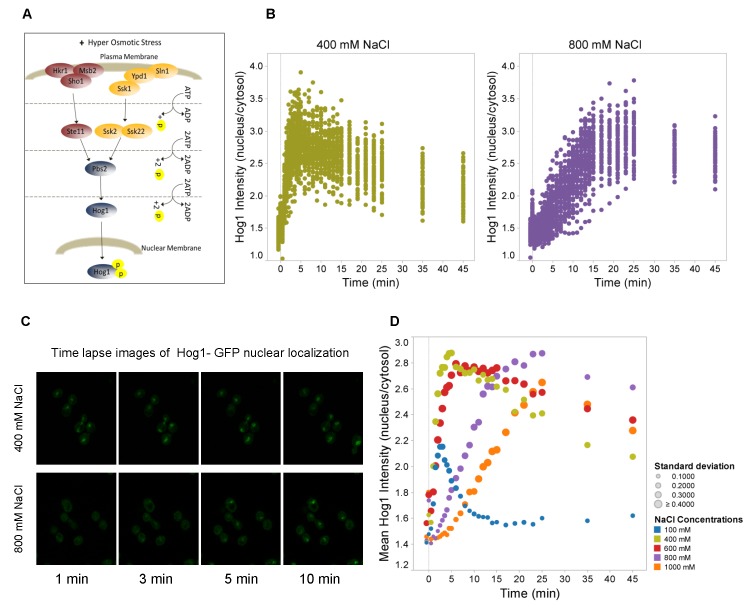
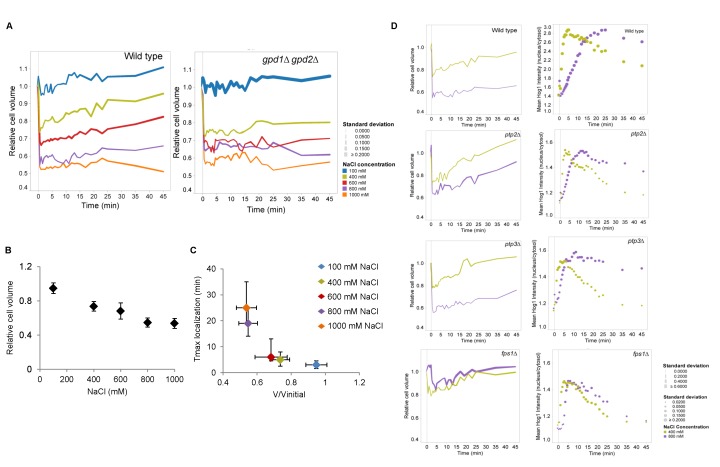
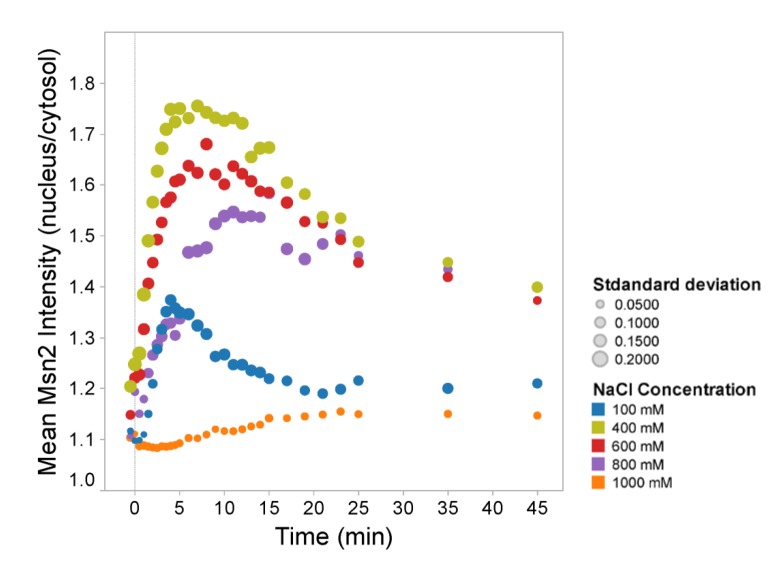
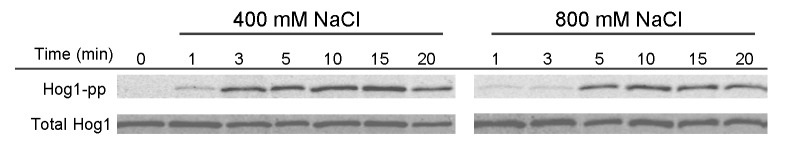
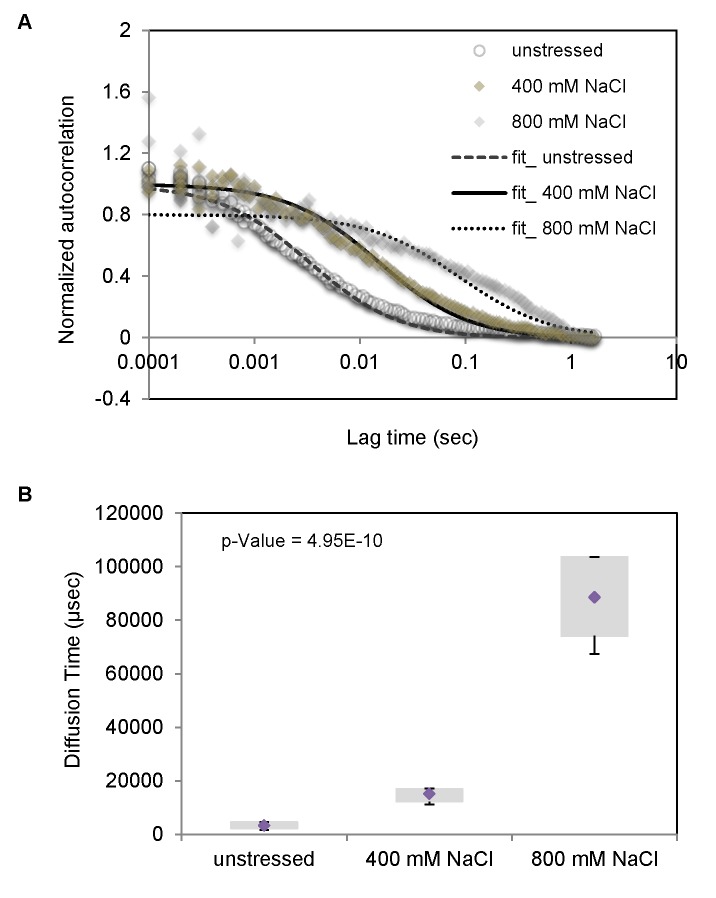
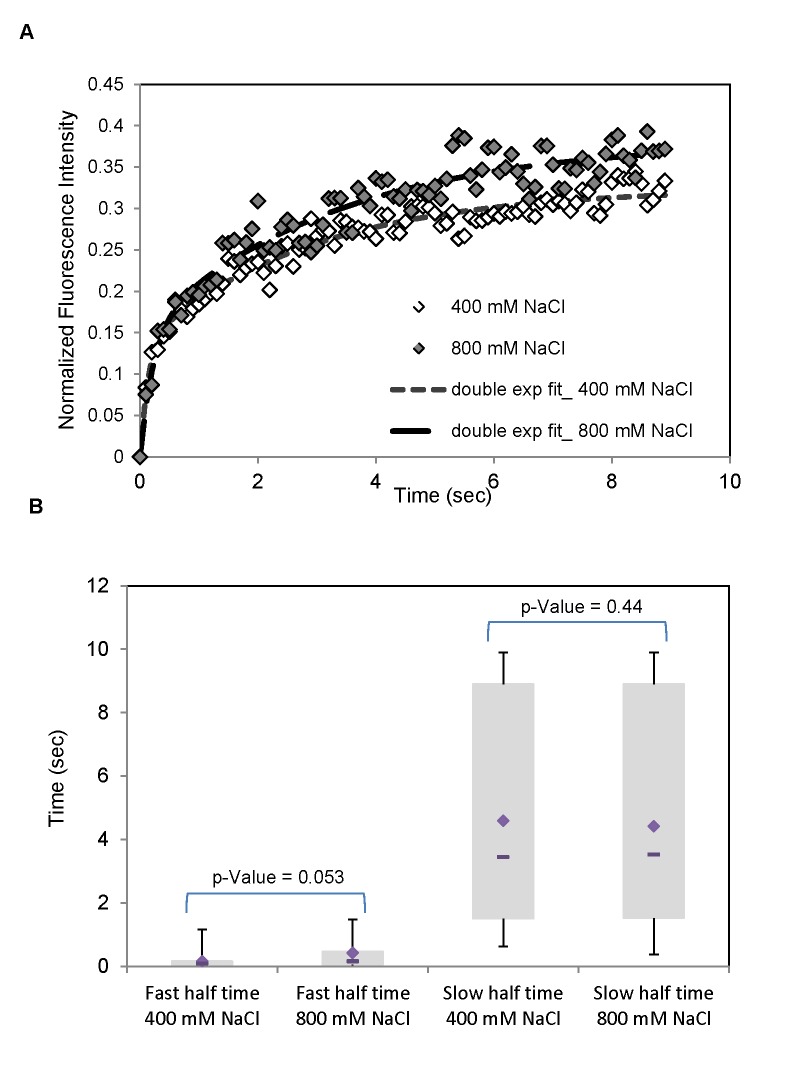
Signal transmission progresses via a series of transient protein-protein interactions and protein movements, which require diffusion within a cell packed with different molecules. Yeast Hog1, the effector protein kinase of the High Osmolarity Glycerol pathway, translocates transiently from the cytosol to the nucleus during adaptation to high external osmolarity. We followed the dynamics of osmostress-induced cell volume loss and Hog1 nuclear accumulation upon exposure of cells to different NaCl concentrations. While Hog1 nuclear accumulation peaked within five minutes following mild osmotic shock it was delayed up to six-fold under severe stress. The timing of Hog1 nuclear accumulation correlated with the degree of cell volume loss and the cells capacity to recover. Also the nuclear translocation of Msn2, the transcription factor of the general stress response pathway, is delayed upon severe osmotic stress suggesting a general phenomenon. We show by direct measurements that the general diffusion rate of Hog1 in the cytoplasm as well as its rate of nuclear transport are dramatically reduced following severe volume reduction. However, neither Hog1 phosphorylation nor Msn2 nuclear translocation were as much delayed as Hog1 nuclear translocation. Our data provide direct evidence that signaling slows down during cell volume compression, probably as a consequence of molecular crowding. Hence one purpose of osmotic adaptation is to restore optimal diffusion rates for biochemical and cell biological processes. In addition, there may be mechanisms slowing down especially Hog1 nuclear translocation under severe stress in order to prioritize Hog1 cytosolic targets.


Conflict of interest statement

Competing Interests: The authors have declared that no competing interests exist.

Figures

Figure 1
Figure 1. Nuclear accumulation of Hog1 is delayed under severe hyperosmotic stress.
A. Scheme of the HOG signaling pathway. Upon hyperosmotic shock a branched cascade mediates dual phosphorylation and activation of Hog1. Phosphorylated Hog1 is then translocated into the nucleus where it associates with different DNA-binding proteins to mediate transcriptional regulation. B. Ratio of Hog1-GFP between nucleus and cytosol as a function of time in wild type cells. At time “0” the medium was adjusted to 400mM and 800mM NaCl, respectively. Data represent values for ca. 60 cells for each condition. C. Confocal time lapse images of the nuclear localization of Hog1 in 400mM and 800mM NaCl. Hog1 nuclear localization is delayed under severe osmotic condition (800mM NaCl). See Figure S2 for control data including Nrd1-mCherry, which marks the nucleus. D. Mean ratio of nuclear versus cytosolic Hog1-GFP of about 60 cells as a function of time upon different stress levels ranging from 100mM to 1,000mM NaCl. Colors symbolize the different salt concentrations and symbol sizes correspond to the standard deviation for each time point as indicated.
Figure 2
Figure 2. Hog1 nuclear accumulation correlates with cell volume recovery dynamics.
A. Relative cell volume changes of cells treated with different concentrations of NaCl in wild type and the gpd1∆ gpd2∆ mutant. Colors indicate different salt concentrations and symbol sizes show the standard deviation for each time point. Ca. 60 cells were monitored. B. Relative cell volume (untreated cells = 1.0) as a function of NaCl concentration in wild type cells. Data represent the average of about 60 cells and the error bars indicate the standard deviation between cells. Cell volume was monitored over time and for each cell the lowest volume value at the relevant salt concentration was used to calculate the average. C. The time point at which Hog1 nuclear concentration reaches its maximum as a function of relative cell volume compression. Data on the y-axis represent the average time point of maximal Hog1 nuclear localization of about 60 cells and the vertical errors bars present the variation between the time points in which cells reach their Hog1 maximum localization. Data on the x-axis represent maximal relative cell volume reduction of those cells and the horizontal bars the standard deviation between cells. D. Changes of relative cell volume (left panels) and Hog1-GFP nuclear localization (right panels) upon treatment with 400mM and 800mM NaCl in wild type, ptp2∆, ptp3∆, and fps1∆ mutants. Colors represent the different salt concentrations and symbol sizes indicate the standard deviation for each time point. Data represent about 60 cells for wild type and ca. 30 cells for each mutant.
Figure 3
Figure 3. Nuclear accumulation of stress-responsive Msn2-GFP is delayed in severe hyper-osmotic stress.
Mean ratio of nuclear versus cytosolic Msn2-GFP as a function of time for different stress levels in wild type. Colors represent different salt concentrations and symbol sizes indicate the standard deviation for each time point.
Figure 4
Figure 4. Hog1 phosphorylation is delayed in severe hyper-osmotic stress.
Western blot of Hog1 phosphorylation in wild type treated with 400mM and 800mM NaCl at time “0”. The upper blot was treated with antibody recognizing dually phosphorylated Hog1, the lower panel with an antibody that detects total Hog1.
Figure 5
Figure 5. Free diffusion of Hog1 in the cytoplasm is strongly reduced in osmo-stressed cells.
A. The average FCS autocorrelation curves of 12 wild type Hog1-GFP, Nrd1-mCherry cells in the absence of stress and in the presence of 400mM, and 800mM NaCl media. B. Hog1-GFP diffusion time for wild type as obtained from the fits of the data represented in (A) in the absence of stress as well as in cells treated with 400mM, and 800mM NaCl, respectively. The bottom and top of the box represent the first and third quartiles. The diamond shows the mean and whiskers indicate the variability of diffusion times outside the upper and lower quartiles for the 12 cells. Measurements were performed 2.5 minutes after cells were treated with salt.
Figure 6
Figure 6. The Hog1 nuclear import rate is similar for cells in different osmotic stress conditions.
A. FRAP (Fluorescence Recovery After Photobleaching) experiments on Hog1-GFP (Nrd1-mCherry as nuclear marker) in wild type cells to measure the rate of Hog1 nuclear import under two different osmostress conditions, 400mM and 800mM NaCl. The recovery curves, i.e. the mean intensity in a nuclear bleached region as a function of time, represent the average of the individual GFP-recovery curves for 15 cells. All measurements were performed after cells were treated with salt for 2.5 minutes. Subsequently, the area of the nucleus was bleached and the times on the x-axis represent the period after which the measurements were started. The recovery curves are fitted with a double exponential fit. B. Box plots for the fast and slow recovery half times from double exponential fits for 400 and 800 mM NaCl. The bottom and top of the boxes present the first and third quartiles. The diamond and dash line show the mean and median respectively. Whiskers indicate the variability of recovery half times outside the upper and lower quartiles. The data are consistent with two different mechanisms of Hog1 nuclear import under osmostress, a slow and probably passive mechanism as well as a fast and probably active mechanism.

Similar articles

Cited by

References

    1. Hohmann S (2002) Osmotic stress signaling and osmoadaptation in yeasts. Microbiol Mol Biol Rev 66: 300-372. doi:10.1128/MMBR.66.2.300-372.2002. PubMed: 12040128. - DOI - PMC - PubMed
    1. Wood JM (2011) Bacterial osmoregulation: a paradigm for the study of cellular homeostasis. Annu Rev Microbiol 65: 215-238. doi:10.1146/annurev-micro-090110-102815. PubMed: 21663439. - DOI - PubMed
    1. Chen RE, Thorner J (2007) Function and regulation in MAPK signaling pathways: lessons learned from the yeast Saccharomyces cerevisiae . Biochim Biophys Acta 1773: 1311-1340. doi:10.1016/j.bbamcr.2007.05.003. PubMed: 17604854. - DOI - PMC - PubMed
    1. Saito H, Posas F (2012) Response to hyperosmotic stress. Genetics 192: 289-318. doi:10.1534/genetics.112.140863. PubMed: 23028184. - DOI - PMC - PubMed
    1. de Nadal E, Posas F (2010) Multilayered control of gene expression by stress-activated protein kinases. EMBO J 29: 4-13. doi:10.1038/emboj.2009.346. PubMed: 19942851. - DOI - PMC - PubMed

Publication types

MeSH terms

Substances

LinkOut - more resources