. 2013 Nov 20;8(11):e80905.
doi: 10.1371/journal.pone.0080905. eCollection 2013.

Nanomechanics of the endothelial glycocalyx in experimental sepsis

Affiliations

Nanomechanics of the endothelial glycocalyx in experimental sepsis

Anne Wiesinger et al. PLoS One. .

Abstract

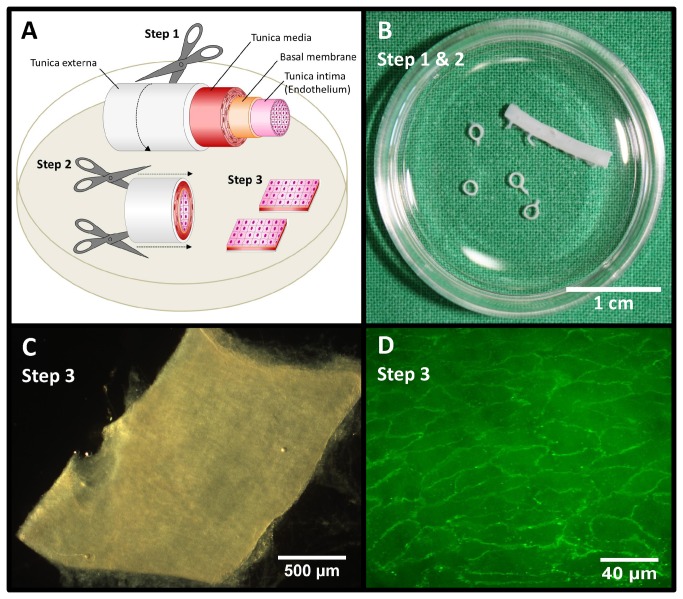
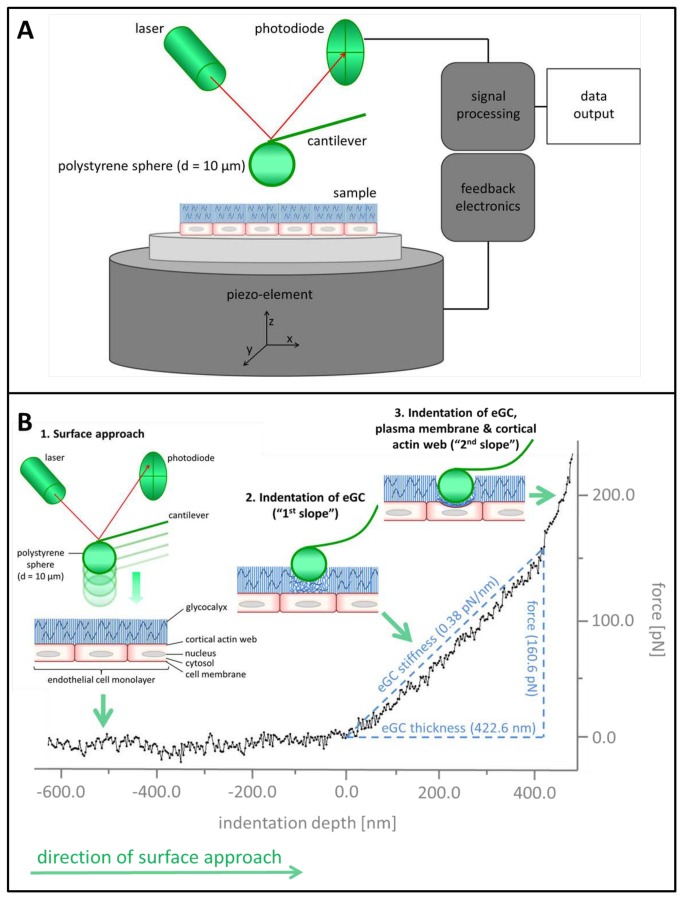
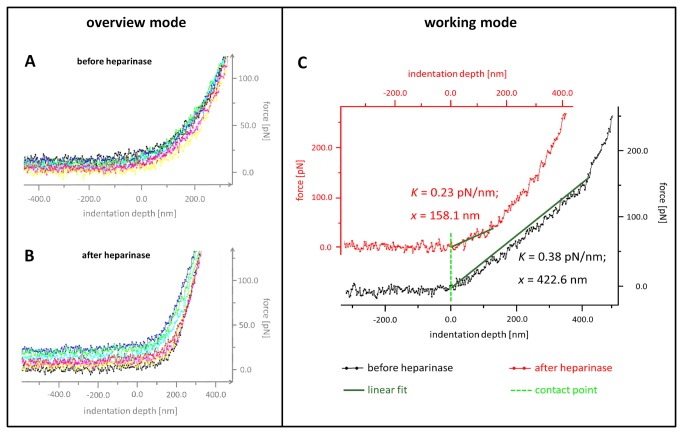
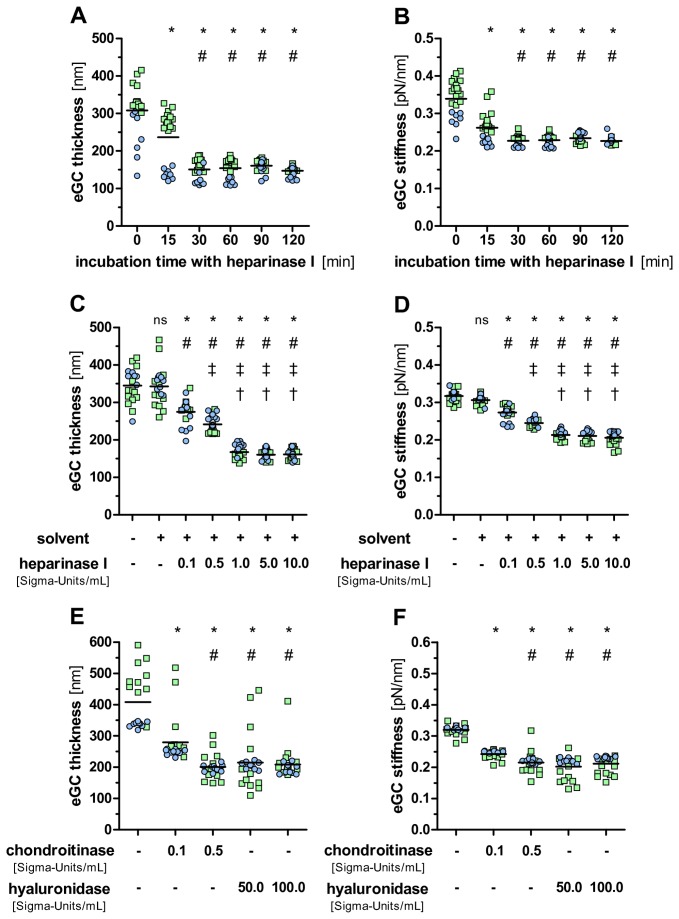
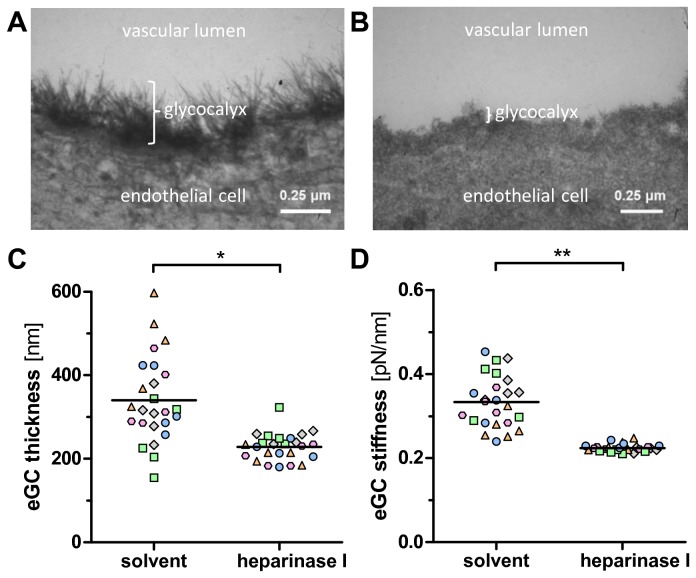
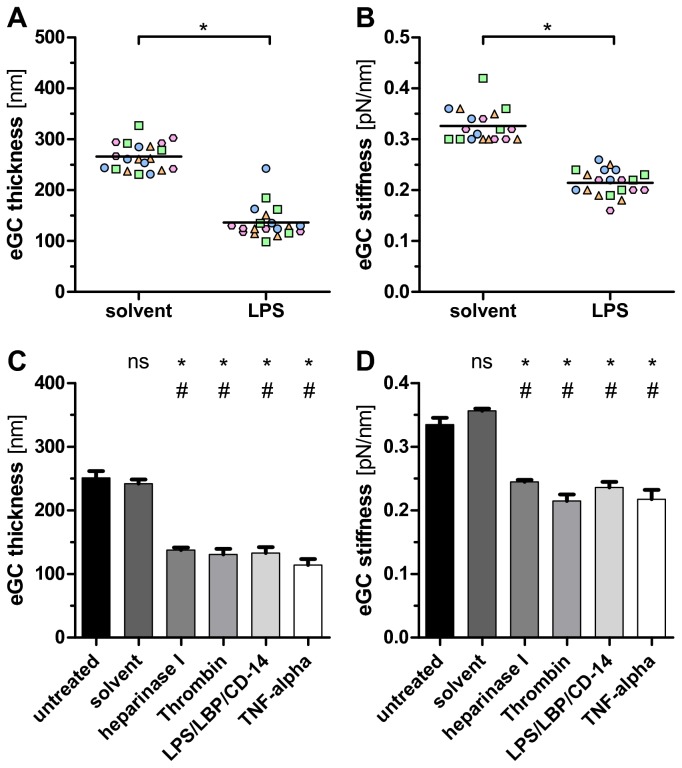
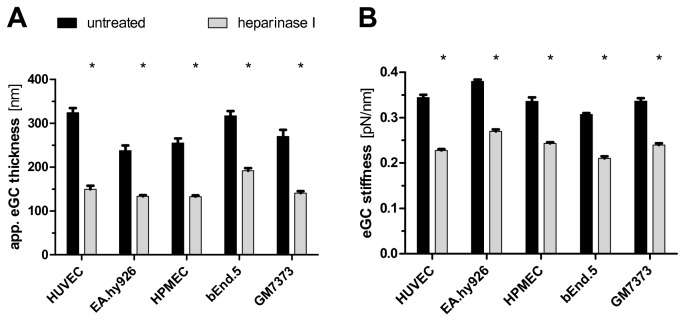
The endothelial glycocalyx (eGC), a carbohydrate-rich layer lining the luminal side of the endothelium, regulates vascular adhesiveness and permeability. Although central to the pathophysiology of vascular barrier dysfunction in sepsis, glycocalyx damage has been generally understudied, in part because of the aberrancy of in vitro preparations and its degradation during tissue handling. The aim of this study was to analyze inflammation-induced damage of the eGC on living endothelial cells by atomic-force microscopy (AFM) nanoindentation technique. AFM revealed the existence of a mature eGC on the luminal endothelial surface of freshly isolated rodent aorta preparations ex vivo, as well as on cultured human pulmonary microvascular endothelial cells (HPMEC) in vitro. AFM detected a marked reduction in glycocalyx thickness (266 ± 12 vs. 137 ± 17 nm, P<0.0001) and stiffness (0.34 ± 0.03 vs. 0.21 ± 0.01 pN/mn, P<0.0001) in septic mice (1 mg E. coli lipopolysaccharides (LPS)/kg BW i.p.) compared to controls. Corresponding in vitro experiments revealed that sepsis-associated mediators, such as thrombin, LPS or Tumor Necrosis Factor-α alone were sufficient to rapidly decrease eGC thickness (-50%, all P<0.0001) and stiffness (-20% P<0.0001) on HPMEC. In summary, AFM nanoindentation is a promising novel approach to uncover mechanisms involved in deterioration and refurbishment of the eGC in sepsis.


Conflict of interest statement

Competing Interests: The authors have declared that no competing interests exist.

Figures

Figure 1
Figure 1. Preparation of rat aorta for AFM analysis ex vivo.
(A-C) Aorta was isolated, freed from surrounding tissue and cut in rings. The aortic rings were split into small preparations (approximately 4 mm2). For atomic force microscopy (AFM) analysis aorta preparations were attached on glass coverslips with the endothelial surface facing upwards. (D) Preservation of the endothelial cell layer after preparation was approved by immunofluorescence staining for CD31 (PECAM-1).
Figure 2
Figure 2. Setup of the atomic force microscope (AFM) used in this study (A) for nanomechanical analysis of the endothelial glycocalyx (eGC) and an original tracing of a force indentation curve performed on the endothelial surface of a rat aorta (B) ex vivo.
1) The AFM tip travels vertically towards the endothelial surface. 2) Upon indentation of the endothelial glycocalyx (eGC), the AFM cantilever, which serves as a soft spring, is deflected. The cantilever deflection is measured as a laser beam reflected from the back of the cantilever and is plotted as a function of sample position along the z axis. The resulting curve is transformed into a force-versus-indentation curve using the cantilever’s spring constant and the optical lever sensitivity. The slope of a force indentation curve then directly reflects the stiffness (expressed in pN/nm), which is necessary to indent the eGC for a certain distance. The first slope indicates the stiffness (in this trace 0.38 pN/nm) of the very first layer, the endothelial glycocalyx (eGC). The second slope indicates the stiffness of the plasma membrane and the cortical actin web. Practically, the slope of a force indentation curve is deduced from a manually plotted regression line (similar to the line in the trace) in PUNIAS (Protein Unfolding and Nano-Indentation Analysis Software, Version 1.0, Release 1.8, http:// punias.voila.net/). In our experience, this slope is virtually linear over its entire length, resulting in a single fixed stiffness value. The distance between the starting point of eGC indentation and the starting point of the second slope (projected to the x-axis) corresponds to the thickness of the eGC (in this trace 422.6 nm).
Figure 3
Figure 3. Original force indentation tracings before (A, C) and after (B, C) heparinase I treatment measured on ex vivo rat aortic samples by AFM.
(A, B) “Overview mode” showing 7 force indentation curves recorded from a single endothelial cell before and after heparinase I treatment, respectively. (C) Each force indentation curve was then analyzed separately using a higher magnification (“working mode”) which facilitates the determination of the thickness and the stiffness of the endothelial glycocalyx by linear approximation. Please note that values on X- and Y-axis in A and B are approximations for graphical illustration.
Figure 4
Figure 4. Time- and dose-dependent effects of enzyme digestion on eGC thickness and stiffness.
Enzymatic removal of heparan sulfate residues by heparinase I in vitro led to a time- and dose-dependent reduction of eGC thickness (A, C) and stiffness (B, D) on freshly-isolated rat aorta preparations. Similar results were obtained using hyaluronidase and chondroitinase (E, F) to strip the eGC of hyaluronan and chondroitin sulfate, respectively. Data shown are from independent AFM experiments using paired aorta preparations derived from two rat aortas (indicated by either green or blue dots). Each dot represents an average of ≥5 force indentation curves per tip-position (i.e. per individual endothelial cell). *P<0.0001 versus untreated; #P<0.01 vs. 15 min, or solvent, or 0.1 S-U/mL chondroitinase, respectively; ‡P<0.001 vs. 0.1 Sigma Units/mL heparinase I; †P<0.0001 vs. 0.5 Sigma Units/mL heparinase I; ns, not significant. Horizontal bars indicate mean values.
Figure 5
Figure 5. Proof of principle that the endothelial surface layer detected by AFM is the eGC.
Enzymatic degradation of the eGC in vivo was induced by infusing healthy rats with heparinase I or solvent (n=5 per group, indicated by different color/shape). After 45 min aortas were harvested for transmission electron microscopy (EM) or AFM analysis, respectively. The heparinase-induced loss of filaments and thinning of the aortic eGC observed by EM (A, B) corresponded well with the decrease in eGC thickness detected by AFM (C, D). Each dot refers to a different tip position showing an average value of ≥5 force indentation curves. For statistical comparison, a single average value per animal was calculated. *P<0.05, **P<0.001. Horizontal bars indicate mean values.
Figure 6
Figure 6. Damage of the eGC in sepsis.
LPS challenge in vivo led to a decrease in eGC thickness (A) and stiffness (B). Adult mice were injected with Lipopoly-saccharides (LPS) from E. coli (1 mg/kg BW) or solvent (n=4 per group, indicated by different color/shape). After 18 h, aortas were harvested and immediately analyzed for eGC by AFM. Each dot refers to a different tip position showing an average value of ≥5 force indentation curves. For statistical comparison, a single average value per animal was calculated. *P<0.001. Treatment with either heparinase I, thrombin, LPS or TNF-α alone for 60 min was sufficient to decreased eGC thickness (C) and stiffness (D) on human pulmonary microvascular endothelial cells (HPMEC) in vitro. Data are expressed as mean (+/- standard error of mean) of n=3 samples per treatment condition. The average value per sample was calculated from a total of 25 force indentation curves, derived from five different tip-positions. *P<0.0001 versus untreated; #P<0.0001 vs. solvent; ns, not significant.
Figure 7
Figure 7. AFM measurements in various types of living endothelial cells in vitro.
AFM nanoindentation measurements in various types of living endothelial cells in vitro, exposed to solvent or heparinase for 60 min. Enzymatic removal of heparan sulfate residues by heparinase I reduced eGC thickness (A) and stiffness (B) on confluent monolayers of human umbilical vein endothelial cells (HUVEC), immortalized human umbilical vein cells (EA.hy926), human pulmonal microvascular endothelial cells (HPMEC, clone ST1.6R), murine brain microvascular cells (bEnd.5), and bovine aortic endothelial cells (GM7373). Data are expressed as mean (+/- standard error of mean) of n=3 samples per treatment condition. The average value per sample was calculated from a total of ≥25 force indentation curves, derived from 15 different tip-positions. *P<0.0001.

References

    1. Goldenberg NM, Steinberg BE, Slutsky AS, Lee WL (2011) Broken barriers: a new take on sepsis pathogenesis. Sci Transl Med 3: 88ps25 PubMed: 21697528. - PubMed
    1. Payen D, de Pont AC, Sakr Y, Spies C, Reinhart K et al. (2008) A positive fluid balance is associated with a worse outcome in patients with acute renal failure. Crit Care 12: R74. doi:10.1186/cc6295. PubMed: 18533029. - DOI - PMC - PubMed
    1. Aird WC (2003) The role of the endothelium in severe sepsis and multiple organ dysfunction syndrome. Blood 101: 3765-3777. doi:10.1182/blood-2002-06-1887. PubMed: 12543869. - DOI - PubMed
    1. Chappell D, Hofmann-Kiefer K, Jacob M, Rehm M, Briegel J et al. (2009) TNF-alpha induced shedding of the endothelial glycocalyx is prevented by hydrocortisone and antithrombin. Basic Res Cardiol 104: 78-89. doi:10.1007/s00395-008-0749-5. PubMed: 18836678. - DOI - PubMed
    1. Mulivor AW, Lipowsky HH (2002) Role of glycocalyx in leukocyte-endothelial cell adhesion. Am J Physiol Heart Circ Physiol 283: H1282-H1291. PubMed: 12234777. - PubMed

Publication types