. 2013 Nov 20;8(11):e81007.
doi: 10.1371/journal.pone.0081007. eCollection 2013.

Feasibility of the use of combinatorial chemokine arrays to study blood and CSF in multiple sclerosis

Affiliations

Feasibility of the use of combinatorial chemokine arrays to study blood and CSF in multiple sclerosis

Keith R Edwards et al. PLoS One. .

Abstract

Meningeal inflammation, including the presence of semi-organized tertiary lymphoid tissue, has been associated with cortical pathology at autopsy in secondary progressive multiple sclerosis (SPMS). Accessible and robust biochemical markers of cortical inflammation for use in SPMS clinical trials are needed. Increased levels of chemokines in the cerebrospinal fluid (CSF) can report on inflammatory processes occurring in the cerebral cortex of MS patients. A multiplexed chemokine array that included BAFF, a high sensitivity CXCL13 assay and composite chemokine scores were developed to explore differences in lymphoid (CXCL12, CXCL13, CCL19 and CCL21) and inflammatory (CCL2, CXCL9, CXCL10 and CXCL11) chemokines in a small pilot study. Paired CSF and serum samples were obtained from healthy controls (n=12), relapsing-remitting MS (RRMS) (n=21) and SPMS (N=12). A subset of the RRMS patients (n = 9) was assessed upon disease exacerbation and 1 month later following iv methylprednisone. SPMS patients were sampled twice to ascertain stability. Both lymphoid and inflammatory chemokines were elevated in RRMS and SPMS with the highest levels found in the active RRMS group. Inflammatory and lymphoid chemokine signatures were defined and generally correlated with each other. This small exploratory clinical study shows the feasibility of measuring complex and potentially more robust chemokine signatures in the CSF of MS patients during clinical trials. No differences were found between stable RRMS and SPMS. Future trials with larger patient cohorts with this chemokine array are needed to further characterize the differences, or the lack thereof, between stable RRMS and SPMS.


Conflict of interest statement

Competing Interests: Authors, except for Dr. K. Edwards, are or were (JB) employees of Biogen Idec and this study was funded by Biogen Idec. Laurie Stephen at RBM provided development support for the multiplex used in this study. There are no patents, products in development or marketed products to declare. These interests do not alter the authors' adherence to all the PLOS ONE polices on sharing data and materials.

Figures

Figure 1
Figure 1. Comparison of three different assays to quantitate CXCL13 in CSF.
“ELISA” refers to a commercial kit (R&D), the “Luminex” is a custom chemokine multiplex assay and Immuno-PCR refers to the ELISA with PCR based quantitation. Samples from all four cohorts of patients are included. The low limit of quantitation (LLOQ) was determined for CXCL13 in CSF and is not the buffer-based assay performance.
Figure 2
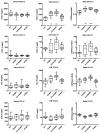
Figure 2. Comparison of the levels of the lymphoid chemokines CXCL12, CXCL13, CCL19 and CCL21 in serum and CSF.
Chemokine concentrations are plotted with box and whiskers (10-90% range) overlaid on the scatter plots (each patient is a symbol). The CSF/serum ratio is presented on the right side. Data are shown for normal controls (NC), relapsing-remitting MS (RRMS), RRMS patients with acute exacerbations (EX-RRMS) and secondary progressive MS patients (SPMS). In those cases with EX-RRMS (9), SPMS (11) and RRMS (2) patients with second lumbar punctures, data from both samples are included. Statistical significance was assessed using only the baseline data and is indicated by asterisks at the bottom of each graph (ANOVA). Data at the lower limit of quantitation were excluded from the ratio plots.
Figure 3
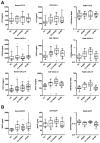
Figure 3. Comparison of the levels of the inflammatory chemokines in serum and CSF.
(A) Concentrations of CXCL9, CXCL10, and CCL2 and (B) the cytokine BAFF are plotted as in Figure 2.
Figure 4
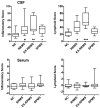
Figure 4. Composite scores for inflammatory (CCL2, CXCL9 and CXCL10) and lymphoid (CXCL12, CXCL13 and CCL19) chemokines.
Baseline-only data are presented for both serum and CSF from NC, RRMS, EX-RRMS and SPMS patients. The composite score for the CSF data is derived from a normalized scale, while the serum data represent the mean of the z-values. Statistical significant is indicated by asterisks at the bottom of each graph (one-way ANOVA to NC).
Figure 5
Figure 5. Relationship between the CSF lymphoid and inflammatory scores for MS patients and healthy normal controls.
Solid circles show the baseline data while open circles are from the repeat lumbar puncture. Lines with arrow heads indicate paired samples from each patient (most MS subjects from the RRMS group did not have two lumbar punctures).
Figure 6
Figure 6. Ratio of CSF to serum chemokine levels in normal patients as well as the relationship to molecular size.
A). Ratio of the CSF to serum chemokine concentrations for normal controls. B). Relationship between the molecular weight of the analyte and the CSF/serum ratio (only normal subjects). Only CCL21 and CXCL12 are plotted and CXCL9, CXCL13 and CCL19 would roughly overlay these values. Chemokines were assumed to be dimeric, BAFF trimeric, IgG dimeric, IgA tetrameric and IgM pentameric. Values above the line are consistent with local CNS production. C). Corresponding Ig indices for the different cohorts.
Figure 7
Figure 7. Trend analyses for each analyte for those individuals with two CSF samples.
Both EX-RRMS and SPMS patients are grouped in the same graph.

Similar articles

Cited by

References

    1. Frischer JM, Bramow S, Dal-Bianco A, Lucchinetti CF, Rauschka H et al. (2009) The relation between inflammation and neurodegeneration in multiple sclerosis brains. Brain 132: 1175-1189. doi:10.1093/brain/awp070. PubMed: 19339255. - DOI - PMC - PubMed
    1. Magliozzi R, Howell OW, Reeves C, Roncaroli F, Nicholas R et al. (2010) A Gradient of neuronal loss and meningeal inflammation in multiple sclerosis. Ann Neurol 68: 477-493. doi:10.1002/ana.22230. PubMed: 20976767. - DOI - PubMed
    1. Reynolds R, Roncaroli F, Nicholas R, Radotra B, Gveric D et al. (2011) The neuropathological basis of clinical progression in multiple sclerosis. Acta Neuropathol 122: 155-170. doi:10.1007/s00401-011-0840-0. PubMed: 21626034. - DOI - PubMed
    1. Lassmann H, van Horssen J (2011) The molecular basis of neurodegeneration in multiple sclerosis. FEBS Lett 585: 3715-3723. doi:10.1016/j.febslet.2011.08.004. PubMed: 21854776. - DOI - PubMed
    1. Lucchinetti CF, Popescu BF, Bunyan RF, Moll NM, Roemer SF et al. (2011) Inflammatory cortical demyelination in early multiple sclerosis. N Engl J Med 365: 2188-2197. doi:10.1056/NEJMoa1100648. PubMed: 22150037. - DOI - PMC - PubMed

Publication types