In vivo quantitative susceptibility mapping (QSM) in Alzheimer's disease
- PMID: 24278382
- PMCID: PMC3836742
- DOI: 10.1371/journal.pone.0081093
In vivo quantitative susceptibility mapping (QSM) in Alzheimer's disease
Abstract
Background: This study explores the magnetostatic properties of the Alzheimer's disease brain using a recently proposed, magnetic resonance imaging, postprocessed contrast mechanism. Quantitative susceptibility mapping (QSM) has the potential to monitor in vivo iron levels by reconstructing magnetic susceptibility sources from field perturbations. However, with phase data acquired at a single head orientation, the technique relies on several theoretical approximations and requires fast-evolving regularisation strategies.
Methods: In this context, the present study describes a complete methodological framework for magnetic susceptibility measurements with a review of its theoretical foundations.
Findings and significance: The regional and whole-brain cross-sectional comparisons between Alzheimer's disease subjects and matched controls indicate that there may be significant magnetic susceptibility differences for deep brain nuclei--particularly the putamen--as well as for posterior grey and white matter regions. The methodology and findings described suggest that the QSM method is ready for larger-scale clinical studies.
Conflict of interest statement
Figures

 : (measured) magnetic induction;
  : exobrain mask;
  : Fourier operator; D: magnetic dipole kernel;
  : dipole operator;
  : (estimated) exobrain dipole distribution;
  : (minimised) conjugate gradient residual matrix;
  : (estimated) background field;
  : (estimated) foreground field.


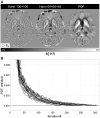
 1250) for a young control scanned in three sessions (time-points: t0-2). Serial behaviour on a single subject was deemed highly robust.
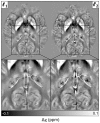
 -norm approach yielded better-compartmentalised maps. The
  -norm method preserved more anatomical detail.
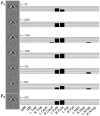
 - and one
  -norm regularisation schemes. Each bar represents an absolute sum-of-ranks difference relative to that for P = 0.05 (if surviving such threshold); each solid horizontal line represents +2 (sum of ranks); and the discontinuous line marks the sum of ranks returning P = 0.005.
 -norm regularised
  values are stable across a large range of parameters; though strong dependency was found for λ<750. Upward trends from young to adult and from healthy to AD, almost complete separation between patients and controls, and narrow serial measurement dispersion were also clearly visible. (B) Histogram plots for regional data from
  1250. (C) Median putamenal magnetic susceptibility values plotted against hippocampal volumes for all subjects in the study.
 1250) differences between AD and elderly control groups overlaid onto the MNI152 template.
References
-
- Schenck JF (1996) The role of magnetic susceptibility in magnetic resonance imaging: MRI magnetic compatibility of the first and second kinds. Med Phys 23: 815–850. - PubMed
-
- Hallgren B, Sourander P (1958) The effect of age on the non-haemin iron in the human brain. J Neurochem 3: 41–51. - PubMed
-
- Gutteridge JM (1992) Iron and oxygen radicals in brain. Ann Neurol 32 Suppl: S16–21 - PubMed
-
- Floyd RA, Carney JM (1993) The role of metal ions in oxidative processes and aging. Toxicol Ind Health 9: 197–214. - PubMed
Publication types
MeSH terms
LinkOut - more resources
Full Text Sources
Other Literature Sources
Medical

