. 2013 Nov 21;8(11):e82011.
doi: 10.1371/journal.pone.0082011. eCollection 2013.

Biochemistry changes that occur after death: potential markers for determining post-mortem interval

Affiliations

Biochemistry changes that occur after death: potential markers for determining post-mortem interval

Andrea E Donaldson et al. PLoS One. .

Abstract

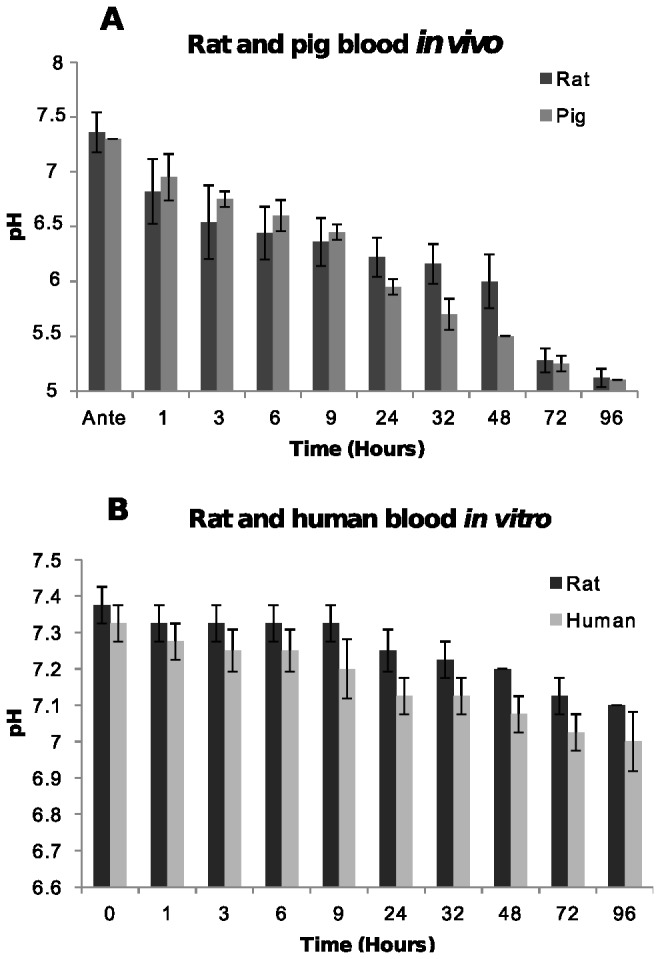
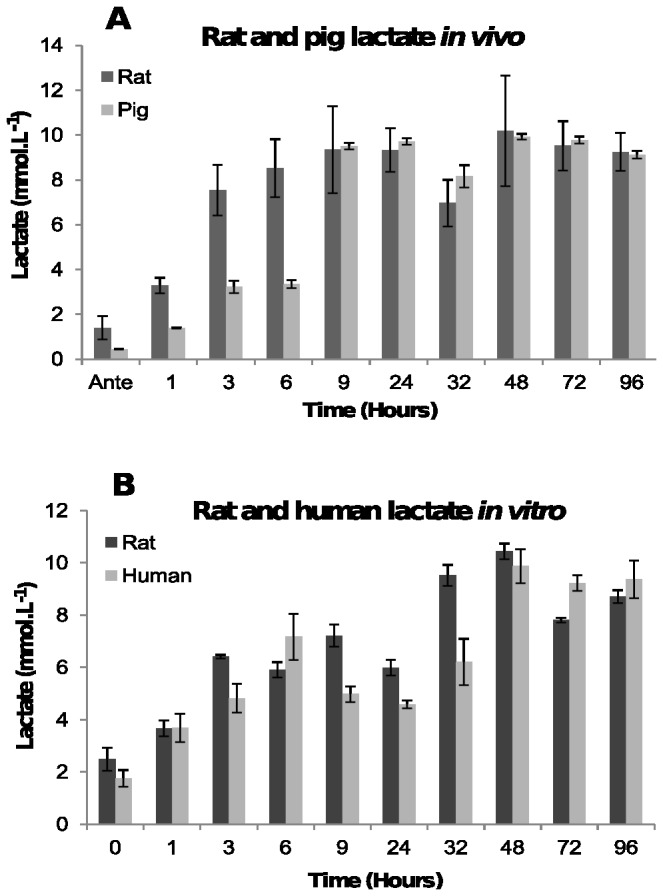
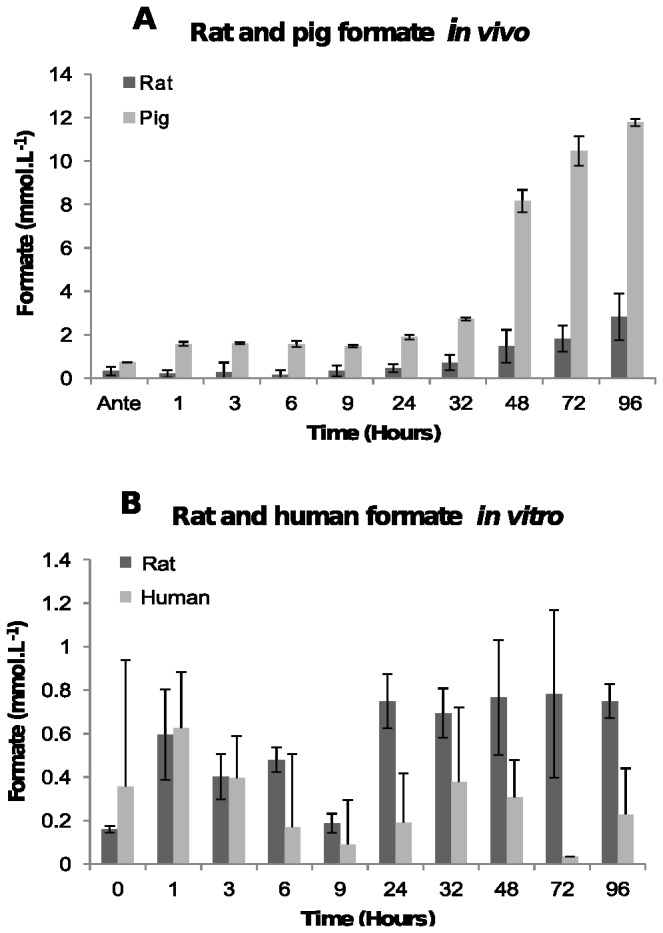
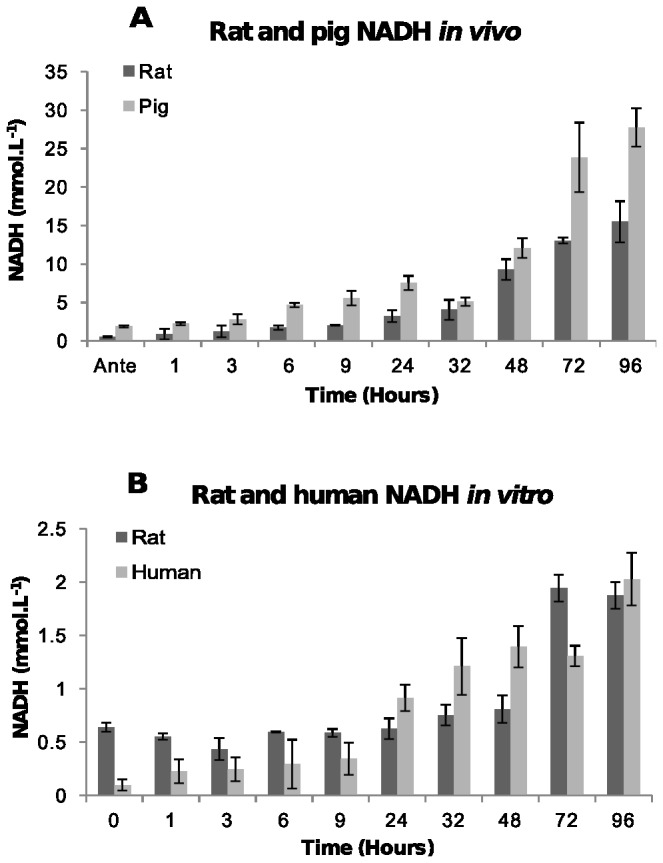
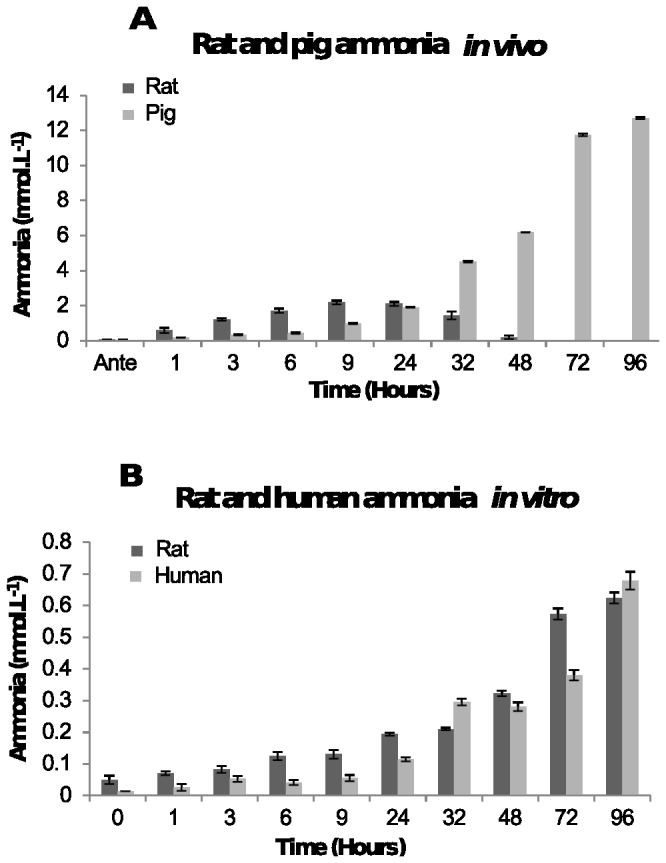
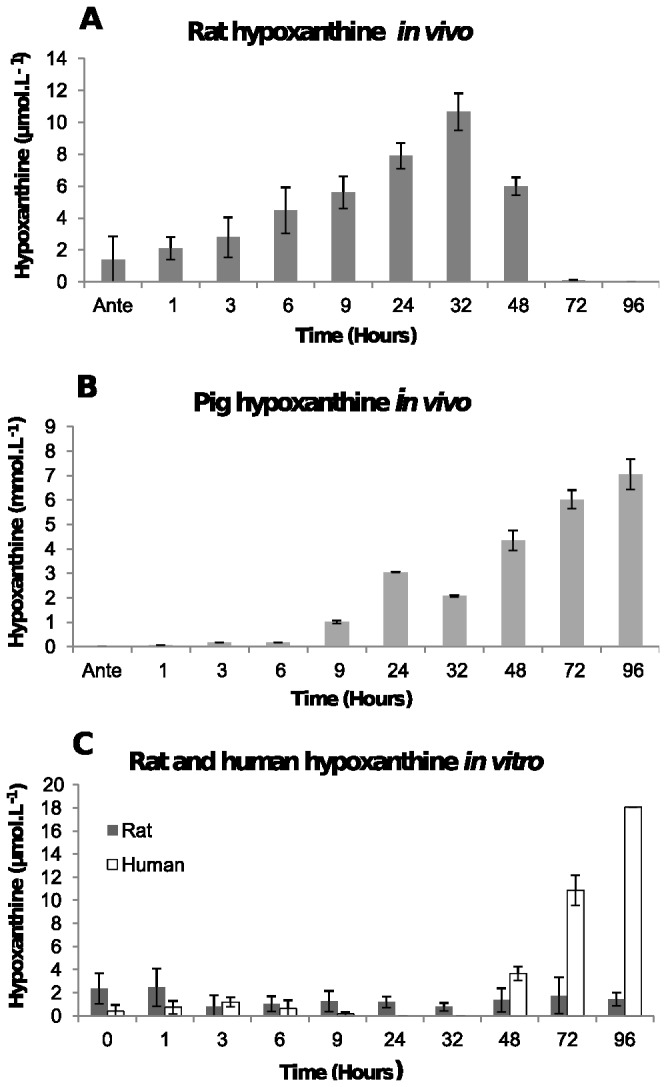
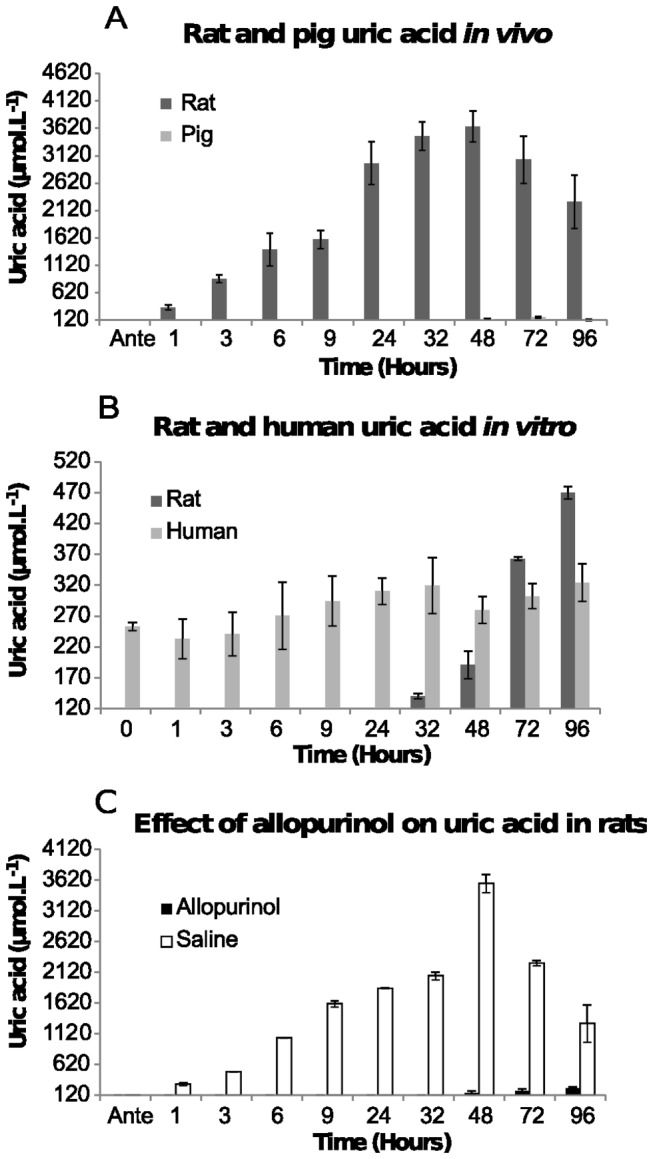
Death is likely to result in very extensive biochemical changes in all body tissues due to lack of circulating oxygen, altered enzymatic reactions, cellular degradation, and cessation of anabolic production of metabolites. These biochemical changes may provide chemical markers for helping to more accurately determine the time since death (post-mortem interval), which is challenging to establish with current observation-based methodologies. In this study blood pH and changes in concentration of six metabolites (lactic acid, hypoxanthine, uric acid, ammonia, NADH and formic acid) were examined post-mortem over a 96 hour period in blood taken from animal corpses (rat and pig) and blood from rats and humans stored in vitro. The pH and the concentration of all six metabolites changed post-mortem but the extent and rate of change varied. Blood pH in corpses fell from 7.4 to 5.1. Concentrations of hypoxanthine, ammonia, NADH and formic acid all increased with time and these metabolites may be potential markers for post-mortem interval. The concentration of lactate increased and then remained at an elevated level and changes in the concentration were different in the rat compared to the human and pig. This is the first systematic study of multiple metabolic changes post-mortem and demonstrates the nature and extent of the changes that occur, in addition to identifying potential markers for estimating post-mortem interval.


Conflict of interest statement

Competing Interests: The authors have declared that no competing interests exist.

Figures

Figure 1
Figure 1. Blood pH.
[A] In post-mortem blood from rat and pig corpses over 96 hours. The average pH of blood samples from five rat and two pig corpses at each time point are shown with standard deviations. [B] In human blood and rat blood stored in a tube. The average pH and standard deviations at each time point from two human and three rat blood samples are shown.
Figure 2
Figure 2. Concentration of lactate.
[A] In post-mortem blood from rat and pig corpses over 96 hours. The average lactate concentration and the standard deviations in blood from seven rats and two pigs at each time point are shown. [B] In human blood and rat blood stored in a tube. The average concentration of lactate and the standard deviation at each time point from three human and two rat blood samples are shown.
Figure 3
Figure 3. Concentration of formate.
[A] In post-mortem blood from rat and pig corpses over 96 hours. The average formate concentration and the standard deviations in blood from four rats and two pigs at each time point are shown. [B] In human blood and rat blood stored in a tube. The average concentration of formate and the standard deviation at each time point from two human and two rat blood samples are shown.
Figure 4
Figure 4. Concentration of NADH.
[A] In post-mortem blood from rat and pig corpses over 96 hours. The average NADH concentration and the standard deviations in blood from six rats and two pigs at each time point are shown. [B] In human blood and rat blood stored in a tube. The average NADH concentration and the standard deviation at each time point from two human and two rat blood samples are shown.
Figure 5
Figure 5. Concentration of ammonia.
[A] In post-mortem blood from rat and pig corpses over 96 hours. The average ammonia concentration and the standard deviations in plasma from six rats and two pigs at each time point are shown. [B] In human blood and rat blood stored in a tube. The average ammonia concentration and the standard deviation at each time point from four human and two rat plasma samples are shown.
Figure 6
Figure 6. Concentration of hypoxanthine.
[A] In post-mortem blood from rat corpses over 96 hours. The average ammonia concentration in plasma and the standard deviations from five rats at each time point are shown. [B] In post-mortem blood from pig corpses over 96 hours. The average hypoxanthine concentration in plasma and the standard deviations from two pigs at each time point are shown. [C] In human blood and rat blood stored in a tube. The average hypoxanthine concentration and the standard deviation at each time point from two human and two rat plasma samples are shown.
Figure 7
Figure 7. Concentration of uric acid.
[A] In post-mortem blood from rat and pig corpses over 96 hours. The average uric acid concentration in plasma and the standard deviations from five rats and two pigs at each time point are shown. [B] In human blood and rat blood stored in a tube. The average uric acid concentration and the standard deviation at each time point from four human and two rat plasma samples are shown. [C] Affect of allopurinol on post-mortem rat uric acid concentrations. Three rats were administered allopurinol and one rat was given saline prior to euthanasia. The average concentration of uric acid is shown along with the standard deviations at each time point.

References

    1. Villas-Boas S, Roessner U, Hansen M, Smedsgaard J, Nielsen J (2007) Metabolome analysis : An introduction. New Jersey: John Wiley & Sons Inc.
    1. Jetter W (1959) Post-mortem Biochemical Changes. J Forensic Sci 4: 330-341.
    1. Marieb EN (1998) Human Anatomy and Physiology. California: Benjamin/Cummings Science Publishing.
    1. Cotran RS, Kumar V, Robbins SL (1994) Cellular injury and cellular death. In: Schoen FJ. Robbins Pathologic Basis of disease, 5th ed. Philadelphia: W.B. Saunders Company; pp. 4-11.
    1. Sawyer WR, Steup DR, Martin BS, Forney RB (1988) Cardiac blood pH as a possible indicator of postmortem interval. J Forensic Sci 33: 1439-1444. PubMed: 3204346. - PubMed

Publication types