. 2013 Nov 21;7(11):e2571.
doi: 10.1371/journal.pntd.0002571. eCollection 2013 Nov.

Highly sensitive in vivo imaging of Trypanosoma brucei expressing "red-shifted" luciferase

Affiliations

Highly sensitive in vivo imaging of Trypanosoma brucei expressing "red-shifted" luciferase

Alex P McLatchie et al. PLoS Negl Trop Dis. .

Abstract

Background: Human African trypanosomiasis is caused by infection with parasites of the Trypanosoma brucei species complex, and threatens over 70 million people in sub-Saharan Africa. Development of new drugs is hampered by the limitations of current rodent models, particularly for stage II infections, which occur once parasites have accessed the CNS. Bioluminescence imaging of pathogens expressing firefly luciferase (emission maximum 562 nm) has been adopted in a number of in vivo models of disease to monitor dissemination, drug-treatment and the role of immune responses. However, lack of sensitivity in detecting deep tissue bioluminescence at wavelengths below 600 nm has restricted the wide-spread use of in vivo imaging to investigate infections with T. brucei and other trypanosomatids.

Methodology/principal findings: Here, we report a system that allows the detection of fewer than 100 bioluminescent T. brucei parasites in a murine model. As a reporter, we used a codon-optimised red-shifted Photinus pyralis luciferase (PpyRE9H) with a peak emission of 617 nm. Maximal expression was obtained following targeted integration of the gene, flanked by an upstream 5'-variant surface glycoprotein untranslated region (UTR) and a downstream 3'-tubulin UTR, into a T. brucei ribosomal DNA locus. Expression was stable in the absence of selective drug for at least 3 months and was not associated with detectable phenotypic changes. Parasite dissemination and drug efficacy could be monitored in real time, and brain infections were readily detectable. The level of sensitivity in vivo was significantly greater than achievable with a yellow firefly luciferase reporter.

Conclusions/significance: The optimised bioluminescent reporter line described here will significantly enhance the application of in vivo imaging to study stage II African trypanosomiasis in murine models. The greatly increased sensitivity provides a new framework for investigating host-parasite relationships, particularly in the context of CNS infections. It should be ideally suited to drug evaluation programmes.


Conflict of interest statement

The authors have declared that no competing interests exist.

Figures

Figure 1
Figure 1. Schematic of pTb-AMluc constructs containing luciferase reporter genes.
We used a modular format for the construction of the pTb-AMluc series of vectors that were designed to target the “red-shifted” luciferase genes PpyRE9H and PpyRE-TS (red) to the rDNA locus of T.b. brucei. The ribosomal locus targeting fragments (green), and VSG, GPEET2 procyclin and tubulin flanking sequences (blue) were derived from parasite DNA by PCR as outlined in Materials and Methods and Supplementary Table 1. IR refers to the intergenic region that the contains processing signal(s) at the 5′-end of the puromycin N-acetyl transferase (PAC) (purple) and the 3′-end of the REH9 luciferase genes. Constructs were linearised by SacI/KpnI digestion prior to transfection.
Figure 2
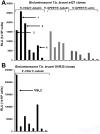
Figure 2. Isolation of T.b. brucei clones expressing high level bioluminescence.
(A) The bioluminescent signal (RLU) detected from T.b. brucei s427 clones transfected with pTb-AMluc constructs in which the PpyRE9H gene was flanked by 5′-VSG and 3′-tubulin, 5′-GPEET2 procyclin and 3′-tubulin, or 5′-GPEET2 procyclin and 3′-actin UTRs (Figure 1). Luciferase assays were carried out on 106 cells (Materials and Methods), with readings taken using a SpectraMax M3 Microplate Reader. The data show that the 5′-VSG/3′-tubulin UTR combination in construct pTb-AMluc-v gives the highest luciferase signal in vitro. Clones 1–4 (indicated) were used in assessment of growth (Figure S1). (B) The bioluminescent signal detected from T.b. brucei GVR35 clones transfected with construct pTb-AMluc-v. Clone VSL2 (indicated) was chosen for in vivo studies.
Figure 3
Figure 3. Limit of detection in vitro.
(A) Images of two 96-well microtitre plates containing dilutions of T.b. brucei GVR35 clone VSL2 and a non-transformed control (WT). Each plate was imaged using an IVIS Lumina (Perkin Elmer) with 1 minute exposure and medium binning. Both cell lines were serially diluted from 1×10⁶ to 1×10³ (upper plate) and from 1×10³ to 1×10² parasites ml−1 (cell numbers shown above each plate). 100 VSL2 parasites could be clearly visualised. Note that the imaging software automatically adjusts the heat-map scale to account for the intensity of the well containing the highest number of parasites. (B) In vitro linear regression plots generated from both plates. Each point corresponds to bioluminescence represented by the total flux recorded from a single well. In both cases, linear regression analysis shows a very strong positive correlation between bioluminescence and parasite number (R2>0.99). The graphs show readings from duplicate wells. In the upper graph, duplicate values were extremely close and are not individually distinguishable. In the lower graph, duplicates are shown as red squares and blue triangles, and the dotted line indicates the background in blank wells (green triangles), plus two standard deviations.
Figure 4
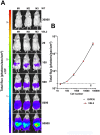
Figure 4. Limit of detection in vivo.
(A) Six sets of three BALB/c mice were inoculated i.p. with either 20, 100, 500, 5000, or 50000 bloodstream form T.b. brucei GVR35 clone VSL2. An additional set of three mice was inoculated with 30000 non-transformed parasites (WT). All of the IVIS Lumina images were acquired using large binning, 5 minute exposures, 15 minutes after infection and 10 minutes after administration of luciferin (150 mg kg−1). It was possible to visualise as few as 100 parasites in the intra-peritoneal space. (B) A dose response curve generated from the in vivo limit of detection data. Mean abdominal bioluminescence was recorded from each group. Linear regression analysis shows a very strong positive correlation between bioluminescence and parasite inoculum (R2>0.99). Dotted line indicates mean bioluminescence plus two standard deviations, from mice infected with wild type parasites.
Figure 5
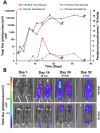
Figure 5. Monitoring the course of infection.
(A) Bioluminescence (total flux) recorded from two BALB/c mice inoculated i.p. with 3×10⁴ T.b. brucei GVR 35 (clone VSL2) vs peripheral blood parasitemia recorded over the course of 36 days. Following infection, the bioluminescence signal fluctuated, peaking at 2×10¹¹ photons/sec/cm2 on day 18, and remaining above 5×10¹⁰ photons/sec/cm2 until drug intervention. After treatment with berenil on day 32 (Materials and Methods), total flux and peripheral parasitemia fell rapidly. (B) Ventral and dorsal in vivo imaging of both mice (Materials and Methods) revealed the rapid growth and dissemination of parasites during the course of infection. Dorsal imaging suggests that as early as day 7, parasites can be detected in the head of both mice. After berenil treatment, the bioluminescent signal was rapidly cleared from the periphery and by day 36 was only weakly detectable. However, there was a strong focal signal localised to the head, particularly apparent when viewed from the dorsal perspective. These mice were sacrificed in accordance with animal welfare regulations. (C) Brains were removed from other mice 33 days post-infection and imaged after perfusion (Materials and Methods). All brains from infected animals showed a clear bioluminescent signal.
Figure 6
Figure 6. Comparison of firefly luciferase and the “red-shifted” variant as reporters in vivo.
CD-1 mice were inoculated with 3×10⁴ bloodstream form trypanosomes expressing yellow firefly luciferase (GVR-LUC2) and the red-shifted variant (GVR35-VSL2). Ventral body (upper) and dorsal head (lower) images of mice were taken after 7 and 21 days using the IVIS Spectrum. Bioluminescence (total flux) and peripheral bloodstream parasitemia values are shown. The mice were then treated i.p. with berenil (Materials and Methods) and imaged 7 days later.
Figure 7
Figure 7. Monitoring the course of infection in C57BL/6N mice.
(A) Bioluminescence (total flux) and peripheral blood parasitemia in mice inoculated i.p. with 3×10⁴ T.b. brucei GVR35 (clone VSL2). Following infection, the bioluminescence signal fluctuated, but remained above 1010 photons/sec/cm2 until termination of the experiment. Mouse 1, which developed a heavier infection, died at day 25. (B) Ventral and dorsal in vivo imaging (Materials and Methods) revealed the rapid growth and dissemination of parasites during the course of infection. Parasites can be detected in the heads of both mice by day 24.

References

    1. WHO (2012) Human African Trypanosomiasis (sleeping sickness). Factsheet No 259.
    1. Wilkinson SR, Kelly JM (2009) Trypanocidal drugs: mechanisms, resistance and new targets. Expert Rev Mol Med 11: e31. - PubMed
    1. Barrett MP, Vincent IM, Burchmore RJ, Kazibwe AJ, Matovu E (2011) Drug resistance in human African trypanosomiasis. Future Microbiol 6: 1037–1047. - PubMed
    1. Checkley AM, Pepin J, Gibson WC, Taylor MN, Jager HR, et al. (2007) Human African trypanosomiasis: diagnosis, relapse and survival after severe melarsoprol-induced encephalopathy. Trans R Soc Trop Med Hyg 101: 523–526. - PubMed
    1. Pepin J, Milord F, Khonde AN, Niyonsenga T, Loko L, et al. (1995) Risk factors for encephalopathy and mortality during melarsoprol treatment of Trypanosoma brucei gambiense sleeping sickness. Trans R Soc Trop Med Hyg 89: 92–97. - PubMed

Publication types