. 2013 Jan 23;1(1):3.
doi: 10.1186/2049-3002-1-3.

Sterol regulatory element binding protein-dependent regulation of lipid synthesis supports cell survival and tumor growth

Affiliations

Sterol regulatory element binding protein-dependent regulation of lipid synthesis supports cell survival and tumor growth

Beatrice Griffiths et al. Cancer Metab. .

Abstract

Background: Regulation of lipid metabolism via activation of sterol regulatory element binding proteins (SREBPs) has emerged as an important function of the Akt/mTORC1 signaling axis. Although the contribution of dysregulated Akt/mTORC1 signaling to cancer has been investigated extensively and altered lipid metabolism is observed in many tumors, the exact role of SREBPs in the control of biosynthetic processes required for Akt-dependent cell growth and their contribution to tumorigenesis remains unclear.

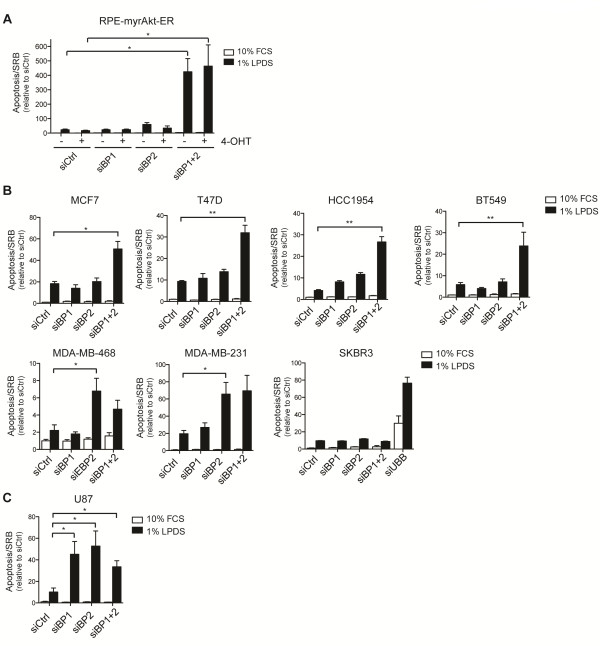
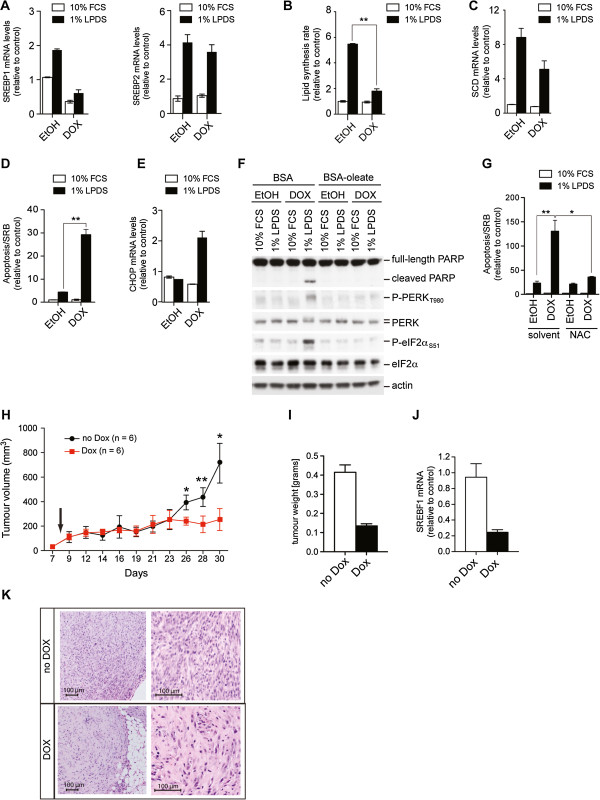
Results: We first investigated the effects of loss of SREBP function in non-transformed cells. Combined ablation of SREBP1 and SREBP2 by siRNA-mediated gene silencing or chemical inhibition of SREBP activation induced endoplasmic reticulum (ER)-stress and engaged the unfolded protein response (UPR) pathway, specifically under lipoprotein-deplete conditions in human retinal pigment epithelial cells. Induction of ER-stress led to inhibition of protein synthesis through increased phosphorylation of eIF2α. This demonstrates for the first time the importance of SREBP in the coordination of lipid and protein biosynthesis, two processes that are essential for cell growth and proliferation. SREBP ablation caused major changes in lipid composition characterized by a loss of mono- and poly-unsaturated lipids and induced accumulation of reactive oxygen species (ROS) and apoptosis. Alterations in lipid composition and increased ROS levels, rather than overall changes to lipid synthesis rate, were required for ER-stress induction.Next, we analyzed the effect of SREBP ablation in a panel of cancer cell lines. Importantly, induction of apoptosis following SREBP depletion was restricted to lipoprotein-deplete conditions. U87 glioblastoma cells were highly susceptible to silencing of either SREBP isoform, and apoptosis induced by SREBP1 depletion in these cells was rescued by antioxidants or by restoring the levels of mono-unsaturated fatty acids. Moreover, silencing of SREBP1 induced ER-stress in U87 cells in lipoprotein-deplete conditions and prevented tumor growth in a xenograft model.

Conclusions: Taken together, these results demonstrate that regulation of lipid composition by SREBP is essential to maintain the balance between protein and lipid biosynthesis downstream of Akt and to prevent resultant ER-stress and cell death. Regulation of lipid metabolism by the Akt/mTORC1 signaling axis is required for the growth and survival of cancer cells.


Figures

Figure 1
Figure 1
Combined ablation of SREBP1 and SREBP2 induces a transcriptional program indicative of endoplasmic reticulum-stress activation. RNA from cells after silencing of control (siCtr), SREBP1 (siBP1), SREBP2 (siBP2) or both (siBP1 + 2) treated with 100 nM 4-OHT or solvent (ethanol) for 24 hours in medium containing 1% lipoprotein deficient serum (LPDS) was used for microarray analysis. Genes regulated in response to combined silencing of SREBP1 and SREBP2 were identified using a false discovery rate (FDR) of 0.01. (A) Heat map showing a two-way cluster analysis of the 417 genes regulated in response to silencing of SREBP1 and SREBP2. (B) Transcription factors (TFs) associated with genes regulated in response to SREBP1 and SREBP2 silencing. r: number of targets in the dataset regulated by this TF; n: number of network objects in the dataset; R: number of targets in the database regulated by this TF; N: total number of gene-based objects in the database; mean: mean value for hypergeometric distribution (n*R/N); z-score: z-score ((r-mean)/sqrt(variance)); P-value: probability to have the given value of r or higher (or lower for negative z-scores). (C) Gene set enrichment analysis (GSEA) was used to study association with transcriptional response to endoplasmic reticulum (ER)-stress. Enrichment plot of gene sets of ATF4, XBP-1 and ATF6 target genes from the literature. (D) Enrichment scores for gene sets derived from the literature. LU_2004_ATF4_select: Table 1 from Lu et al. [24]. ADACHI_2008_ATF6: Table 1 from Adachi et al. [16]. LU_2004_ATF4_all: Additional file 2: Table S1 from Lu et al. [24]. ACOSTA_ALVEAR_2007_XBP1: Table S5 from Acosta-Alvear et al. [25]. SIZE = number of genes within set; NES = Normalized Enrichment Score; q-value = FDR-adjusted P-value.
Figure 2
Figure 2
Inhibition of SREBP function induces ER-stress. (A) Schematic overview of the ER-stress pathway. (B) RPE-myrAkt-ER cells were transfected with siRNA targeting SREBP1 (siBP1), SREBP2 (siBP2) or both (siBP1 + 2). Scrambled siRNAs were used as controls (siCtr). At 72 hours post-transfection, cells were placed in medium containing 1% LPDS and treated with 100 nM 4-OHT or solvent (ethanol) for 24 hours. Phosphorylation of PERK (threonine 980) and eIF2α (serine 51) was determined. Actin was used as a loading control. (C) cDNA from cells treated as in B was analyzed for expression of SREBP1, SREBP2 and C/EBP-homologous protein (CHOP) by quantitative reverse transcriptase PCR (qRT-PCR). Graphs show mean ± standard error of the mean (SEM) of three independent replicates. (D) Splicing of XBP-1 was determined by RT-PCR. Bands representing the unspliced (XBP-1us) and spliced transcript (XBP-1 s) are marked. (E) Cleaved ATF6 (50 kDa) was detected by immunoblotting. Treatment with 50 nM thapsigargin (TG) or 6 μM tunicamycin (TM) was used as control. (F) Cells depleted of SREBP1 and SREBP2 were treated with 100 nM 4-OHT or 10 mM of 4-phenyl butyric acid (PBA) for 24 hours as indicated. Phosphorylation of PERK and eIF2α was determined. (G) CHOP expression in cells treated in parallel to F. Graphs show mean ± (SEM) of three independent replicates. (H) Effect of PBA treatment on XBP-1 splicing. 50 nM thapsigargin (TG) was used as control. (I) Effect of SREBP depletion on protein synthesis. Graph shows mean and range of two independent experiments. *P < 0.05; **P < 0.01.
Figure 3
Figure 3
Depletion of SREBP alters the cellular lipid spectrum and causes loss of mono-unsaturated fatty acids. (A) Lipid analysis of cells depleted of SREBP1 (siBP1) or SREBP2 (siBP2) either alone or in combination (siBP1 + 2) and treated with 100 nM 4-OHT or solvent (ethanol) for 24 hours in medium containing 1% LPDS. Heat map represents log 2 fold changes in concentrations of the different lipid species relative to control-transfected cells (siCtr) treated with solvent (ethanol) (see Additional file 6: Table S2 for complete dataset). (B) Heat map representing changes in free fatty acid species. The percentage of each fatty acid in the control sample is also indicated (% of total). Arrows indicate palmitoleic and oleic acid (see Additional file 7: Table S3 for complete dataset). (C) Diagram showing the synthetic pathway for the generation of unsaturated fatty acids. Desaturation of C:16 and C:18 fatty acids by stearoyl-CoA desaturase (SCD) is the rate-limiting step. (D) Graphs showing the changes in the two major mono-unsaturated fatty acids, oleic and palmitoleic acid, following SREBP depletion represented as percentage of total free fatty acids (FFA). Graphs show mean and range of two independent experiments. (E) Changes in the two major saturated fatty acids, stearic and palmitic acid, following SREBP depletion represented as percentage of total free fatty acids (% of FFA). Graphs show mean and range of two independent experiments. ELOVL, long-chain fatty-acyl elongase; FADS, fatty acid desaturase.
Figure 4
Figure 4
Induction of ER-stress following depletion of SREBP is blocked by serum lipids or oleate. (A) Cells depleted of SREBP1 and SREBP2 (siBP1 + 2) were placed in medium with 10% FCS or 1% LPDS, treated with 100 nM 4-OHT or solvent (ethanol) for 24 hours. Lysates were analyzed for phosphorylation of PERK and eIF2α. (B) Cells were depleted of SREBP1 and SREBP2 and treated with 100 nM 4-OHT or solvent in medium containing 1% LPDS supplemented with BSA or BSA-coupled oleate (300 μM oleate) for 24 hours. Phosphorylation of PERK and eIF2α was determined. (C) cDNA from cells treated as in B was used to determine CHOP expression by qRT-PCR. Graph shows mean ± SEM of three independent replicates. (D) Effect of oleate treatment on XBP-1 splicing. Cells treated with 50 nM thapsigargin (TG) were used as control. Line indicates removal of unrelated lanes from scanned gel image. (E) Induction of apoptosis (cleaved poly (ADP-ribose) polymerase (PARP)) in cells treated with BSA, BSA-oleate or BSA-stearate (both 300 μM fatty acid). Actin is shown as a loading control. (F) Expression of stearoyl-CoA desaturase (SCD) protein following Akt activation and SREBP silencing. (G) Parental RPE cells were treated with 1 μM of A939572 in medium with 10% FCS or 1% LPDS. Induction of CHOP was determined by qRT-PCR. (H) Phosphorylation of PERK (upper band) and eIF2α in cells treated with A939572 as in G. (I) Effect of SREBP depletion on CHOP induction was determined in empty vector (pBabe-EV) or SCD expressing cells (pBabe-SCD). (J) Expression of SCD mRNA in empty vector (pBabe-EV) or SCD expressing cells (pBabe-SCD). **P < 0.01.
Figure 5
Figure 5
Depletion of SREBP1 and SREBP2 causes reactive oxygen species (ROS) accumulation. (A) Levels of reactive oxygen species (ROS) in cells depleted of SREBP1 (siBP1) and SREBP2 (siBP2) or both (siBP1 + 2) and treated with 100 nM 4-OHT or solvent for 24 hours in medium with 1% LPDS. Graph shows mean ± SEM of three independent experiments. (B) Cells were treated as in A but in the presence or absence of 10 mM of the antioxidant N-acetyl cysteine (NAC). Lysates were analyzed for phosphorylation of PERK (* = unspecific band). (C) Expression of CHOP in cells treated as in B. Graph shows mean ± SEM of three independent replicates. (D) Effect of NAC on XBP-1 splicing. Treatment with 50 nM thapsigargin (TG) was used as control. (E) ROS levels in SREBP-depleted cells treated with 4-OHT or solvent in medium with 10% FCS or 1% LPDS for 24 hours. Graph shows mean and range of two independent experiments. (F) Total ROS levels in cells depleted of SREBP and treated with 4-OHT or solvent in medium containing 1% LPDS supplemented with BSA or BSA-coupled oleate (300 μM oleate) for 24 hours. Graph shows mean and range of two independent experiments. (G) Mitochondrial ROS levels in cells treated as in F. Graph shows mean ± SEM of three independent experiments. (H) Mitochondrial respiration of control and SREBP depleted cells was determined using a Seahorse Bioanalyzer. Cells were treated with 4-OHT (solid lines) or solvent (dashed lines) for 24 hours in medium with 1% LPDS. Mitochondrial respiratory capacity was determined in the presence of FCCP. (I) Mitochondrial respiration after addition of BSA (0.3%, dashed lines) or BSA oleate (300 μM oleate, solid lines). *P < 0.05; **P < 0.01; ns = non-significant.
Figure 6
Figure 6
Induction of apoptosis following depletion of SREBP in cancer cells is restricted to lipoprotein deplete conditions. (A) RPE-myrAkt-ER cells were transfected with 25 nM siRNA oligonucleotides targeting SREBP1, SREBP2 or a combination of both. After 48 hours, cells were placed in medium containing 10% FCS or 1% LPDS for a further 48 hours in the presence of 100 nM 4-OHT or solvent (ethanol). Cell viability was determined by measuring caspase 3/7 activity (Apoptosis) normalized to total protein content (SRB). Graph shows mean ± SEM of three independent experiments. (B) The effect of SREBP depletion on cell viability in breast cancer cells. Cells were treated and analyzed as in A. Graphs show mean ± SEM of three independent experiments. Cell lines carry different mutations in components of the PI3-kinase pathway: MCF7 (PIK3CA E545K), T47D (PIK3CA L194F), HCC1954 (PIK3CA H1047R), BT549 (PTENnull), MDA-MB-468 (PTENnull), MDA-MB-231 (KRAS G13D) and SKBR3 (HER2 amplification). Information on cancer gene mutations was obtained from the Wellcome Trust Sanger Institute Cancer Genome Project (http://www.sanger.ac.uk/genetics/CGP). (C) Effect of depletion of SREBP1 or SREBP2 on viability of U87 glioblastoma cells. Graph shows mean ± SEM of three independent experiments. *P < 0.05; **P < 0.01.
Figure 7
Figure 7
SREBP1 is essential for cell viability and in vivo tumor growth. (A) U87-GFP-Tet-pLKO-shSREBP1 cells were treated with 1 μg/ml doxycycline or solvent (ethanol) for 48 hours before being placed in medium containing either 10% FCS or 1% LPDS for a further 24 hours. Expression of SREBP1 and SREBP2 was determined. Graphs show mean and range of two independent experiments. (B) Cells were treated as in A and acetate-dependent de novo lipid synthesis was determined. Graph shows mean ± SEM of three independent experiments. (C) Expression of stearoyl-CoA desaturase (SCD) in U87 cells depleted of SREBP1. Graph shows mean and range of two independent experiments. (D) Induction of apoptosis was determined in cells depleted of SREBP1. Cells were treated with 1 μg/ml doxycycline or solvent for 48 hours before being placed in medium containing either 10% FCS or 1% lipoprotein depleted serum (LPDS) for the final 64 hours. Graph shows mean ± SEM of three independent experiments. (E) Expression of CHOP in cells treated as in A. Graph shows mean and range of two independent experiments. (F) Cells were treated with 1 μg/ml doxycycline or solvent for 48 hours before being placed in medium containing either 10% FCS or 1% LPDS for the final 24 hours. Lysates were analyzed for cleaved PARP and PERK and eIF2α phosphorylation. (G) Cells were treated as in D but 10 mM NAC was added prior to placing into lipoprotein-deplete conditions. Graph shows mean ± SEM of three independent experiments. (H) Nude mice (nu/nu, 6 per group) were injected subcutaneously with 5x10⁶ U87-GFP-Tet-pLKO-shSREBP1 cells. Silencing was induced in the treatment group by addition of doxycycline to the food (day 8). Tumor volumes were determined over 30 days. Graph shows mean ± SEM. (I) Weight of tumors at day 30. Graph shows mean ± SEM. (J) Expression of SREBP1 in tumors at day 30. Graph shows mean ± SEM. (K) Histological analysis of tumors (hematoxylin and eosin staining). *P < 0.05; **P < 0.01.

References

    1. Ma XM, Blenis J. Molecular mechanisms of mTOR-mediated translational control. Nat Rev Mol Cell Biol. 2009;10:307–318. doi: 10.1038/nrm2672. - DOI - PubMed
    1. Laplante M, Sabatini DM. An emerging role of mTOR in lipid biosynthesis. Curr Biol. 2009;19:R1046–R1052. doi: 10.1016/j.cub.2009.09.058. - DOI - PMC - PubMed
    1. Lewis CA, Griffiths B, Santos CR, Pende M, Schulze A. Regulation of the SREBP transcription factors by mTORC1. Biochem Soc Trans. 2011;39:495–499. doi: 10.1042/BST0390495. - DOI - PubMed
    1. Bengoechea-Alonso MT, Ericsson J. SREBP in signal transduction: cholesterol metabolism and beyond. Curr Opin Cell Biol. 2007;19:215–222. doi: 10.1016/j.ceb.2007.02.004. - DOI - PubMed
    1. Horton JD. Sterol regulatory element-binding proteins: transcriptional activators of lipid synthesis. Biochem Soc Trans. 2002;30:1091–1095. - PubMed