. 2013 Nov 26;6(303):ra102.
doi: 10.1126/scisignal.2004373.

The ζ isoform of diacylglycerol kinase plays a predominant role in regulatory T cell development and TCR-mediated ras signaling

Affiliations

The ζ isoform of diacylglycerol kinase plays a predominant role in regulatory T cell development and TCR-mediated ras signaling

Rohan P Joshi et al. Sci Signal. .

Abstract

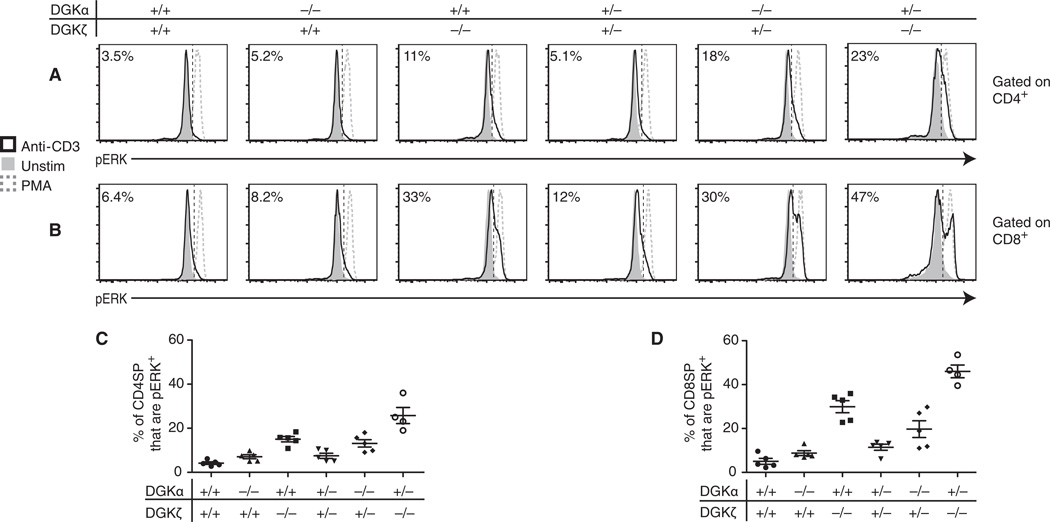
Diacylglycerol (DAG) is a critical second messenger that mediates T cell receptor (TCR)-stimulated signaling. The abundance of DAG is reduced by the diacylglycerol kinases (DGKs), which catalyze the conversion of DAG to phosphatidic acid (PA) and thus inhibit DAG-mediated signaling. In T cells, the predominant DGK isoforms are DGKα and DGKζ, and deletion of the genes encoding either isoform enhances DAG-mediated signaling. We found that DGKζ, but not DGKα, suppressed the development of natural regulatory T (T(reg)) cells and predominantly mediated Ras and Akt signaling downstream of the TCR. The differential functions of DGKα and DGKζ were not attributable to differences in protein abundance in T cells or in their localization to the contact sites between T cells and antigen-presenting cells. RasGRP1, a key DAG-mediated activator of Ras signaling, associated to a greater extent with DGKζ than with DGKα; however, in silico modeling of TCR-stimulated Ras activation suggested that a difference in RasGRP1 binding affinity was not sufficient to cause differences in the functions of each DGK isoform. Rather, the model suggested that a greater catalytic rate for DGKζ than for DGKα might lead to DGKζ exhibiting increased suppression of Ras-mediated signals compared to DGKα. Consistent with this notion, experimental studies demonstrated that DGKζ was more effective than DGKα at catalyzing the metabolism of DAG to PA after TCR stimulation. The enhanced effective enzymatic production of PA by DGKζ is therefore one possible mechanism underlying the dominant functions of DGKζ in modulating T(reg) cell development.


Figures

Fig. 1
Fig. 1. DGKα-deficient mice, unlike DGKζ-deficient mice, exhibit no increase in the percentage of Treg cells but have increased numbers of Treg cell precursors
(A) Top: Representative flow cytometric profiles of freshly isolated thymocytes gated on live singlet cells. Bottom: Gated CD4 SP thymocytes were analyzed for FoxP3 and CD25. Numbers indicate the percentage of cells enclosed within each plot. (B) Summary of the percentages of the CD4 SP thymocytes in thymi from the indicated mice that were FoxP3+. (C) Summary of the percentages of CD4 SP thymocytes in thymi from the indicated mice that were CD25+FoxP3 (enriched for Treg cell precursors). (D) Top: Representative flow cytometric profiles of freshly isolated splenocytes from the indicated mice gated on live singlet cells. Bottom: Gated CD4 SP splenocytes from the indicated mice were analyzed for FoxP3 and CD25. (E) Summary of the percentages of CD4 SP splenocytes from the indicated mice that were FoxP3+. Data in (B) and (E) are means ± SEM from eight mice of each genotype from a single experiment, and are representative of three independent experiments. Data in (C) are means ± SEM from four mice of each genotype from a single experiment, and are representative of two independent experiments. *P < 0.05, **P < 0.01, ***P < 0.001, as determined by one-way analysis of variance (ANOVA) with Tukey’s post-test.
Fig. 2
Fig. 2. DGKζ suppresses TCR-dependent ERK phosphorylation to a greater extent than does DGKα
(A to D) Splenocytes were isolated from wild-type (WT), DGKα−/−, and DGKζ−/− mice, rested for 2 hours in serum-free medium, and then stimulated with anti-CD3 antibody for 15 min or with phorbol 12-myristate 13-acetate (PMA; 1 µg/ml) for 15 min, as a positive control. Representative flow cytometric plots of pERK abundance for (A) gated CD4 SP splenocytes and (B) gated CD8 SP splenocytes. Genotypes are indicated at the top. The percentages within each plot indicate the percentage of cells that contained pERK after 15 min of stimulation. The pERK+ gate, indicated by the dotted line, was defined on the basis of maximal stimulation of the cells with PMA. Summary of the percentages of (C) CD4 SP splenocytes and (D) CD8 SP splenocytes that contained pERK. For statistical analysis, see Table 1. Data in (C) and (D) are means ± SEM from four to five mice of each genotype from two independent experiments.
Fig. 3
Fig. 3. DGKζ suppresses TCR-dependent phosphorylation of Akt and S6 to a greater extent than does DGKα
(A to D) Splenocytes were isolated from WT, DGKα−/−, and DGKζ−/− mice, rested for 2 hours in serum-free medium, and stimulated with anti-CD3 antibody for 5 or 15 min, or with PMA (1 µg/ml) for 15 min, as a positive control. Representative flow cytometric plots of pSLP76, pAkt(S473), and pS6 in (A) gated CD4 SP splenocytes and (B) CD8 SP splenocytes are shown. Summary of the percentages of (C) CD4 SP splenocytes and (D) CD8 SP splenocytes that contained pAkt and pS6. The gates for the indicated phosphorylated proteins were defined on the basis of maximal stimulation of cells with PMA. Data in (C) and (D) are means ± SEM from four independent experiments. *P < 0.05, **P < 0.01, ***P < 0.001, as determined by repeated-measures ANOVA with Tukey’s post-test.
Fig. 4
Fig. 4. DGKα and DGKζ do not share redundant functions in suppressing TCR-dependent phosphorylation of ERK, Akt, or S6
(A and B) CD45.2+DGKζ−/− bone marrow cells were transduced with empty virus (Vector) or with viruses encoding DGKα or DGKζ and then were transferred into CD45.1+ irradiated host mice. After hematopoietic reconstitution, splenocytes were isolated and stimulated with an anti-CD3 antibody for 15 min. Left: Representative flow cytometric plots of pERK, pAkt, and pS6 in cells that were gated on (A) CD45.2+CD4+ or (B) CD45.2+CD8+ and then were gated as GFP+ or GFP, as indicated. Right: Ratios of the percentages of GFP+ to GFP cells that were positive for pERK, pAkt, and pS6 among (A) CD45.2+CD4+ cells and (B) CD45.2+CD8+ cells. Ratios of 1 and <1 correspond to there being similar or less phosphoprotein-containing cells in transduced versus nontransduced cells, respectively. The gates for the indicated phosphorylated proteins were defined on the basis of maximal stimulation of cells with PMA. Data are medians with interquartile range from at least five mice for each genotype from two independent experiments. ***P < 0.001 by one-way ANOVA on log-transformed data with Tukey’s post-test.
Fig. 5
Fig. 5. DGKα and DGKζ localize to similar degrees at the contact site between a T cell and an APC
(A) OT-II DGKζ−/− T cells transduced with retroviruses encoding eGFP-DGKα or eGFP-DGKζ were conjugated with ovalbumin (OVA) peptide-pulsed B cells, fixed, and incubated with an anti-talin antibody to mark the immunological synapse. Representative confocal microscopy images captured 5 min after the initiation of cell conjugation are shown. GFP is in green, talin is in white, 4’,6-diamidino-2-phenylindole (DAPI; which stains nuclei) is in blue, and CMTMR-labeled B cells are in magenta. Scale bar, 5 µm. (B) Ratio of the average GFP intensity in areas corresponding to one-third of the cell (proximal to the immunological synapse, in the middle of the cell, or distal to the immunological synapse) to the average GFP intensity of the whole cell. Data are from measurements made 5 min after the initiation of conjugation of the indicated T cells. *P< 0.05, ***P < 0.001, by Kruskal-Wallis with Dunn’s post-test. (C) Comparison of the accumulation of eGFP-DGKα and eGFP-DGKζ at the T cell-APC contact sites (proximal third) or the distal poles (distal third) of T cells at 5 min after cell conjugate formation. n.s., not significant. (D) Percentages of the total amount of cellular GFP that was localized in talin-containing areas of the indicated T cells. Data are means ± SEM from at least 30 cells for all sets of images from three independent experiments. **P < 0.01 by Mann-Whitney test.
Fig. 6
Fig. 6. RasGRP1 associates in greater amounts with DGKζ than with DGKα
(A and B) Control HEK 293T cells and transduced HEK 293T cells expressing either eGFP-DGKα, or eGFP-DGKζ were transfected with a RasGRP1-expressing plasmid. After 48 hours, cells were lysed, and lysates were divided into three aliquots. (A) Lysates were subjected to immunoprecipitation with an anti-GFP antibody and then were analyzed by Western blotting with anti-GFP or anti-RasGRP1 antibodies. β-Tubulin was used as a loading control. Densitometric analysis was performed to quantify and compare band intensities for the Western blot shown by dividing anti-RasGRP1 staining intensity by anti-GFP staining intensity and normalizing to the ratio for DGKα. (B) Lysates were subjected to immunoprecipitation with an anti-RasGRP1 antibody or with normal rabbit immunoglobulin G (IgG) as a control, and samples were analyzed by Western blotting with anti-GFP and anti-RasGRP1 antibodies. Densitometric analysis was performed to quantify and compare band intensities for the Western blot shown by dividing anti-GFP staining intensity by anti-RasGRP1 staining intensity and normalizing to the ratio for DGKα. (C) Ratio of anti-RasGRP1 staining intensity to anti-GFP staining intensity for DGKα and DGKζ for five independent experiments. (D) Ratio of anti-GFP staining intensity to anti-RasGRP1 staining intensity for DGKα and DGKζ for four independent experiments. Western blots shown are representative of at least four independent experiments. Data are means ± SEM. *P < 0.05 by paired t test.
Fig. 7
Fig. 7. DGKζ has a greater effective enzymatic activity than that of DGKα in T cells
(A) The extent of ERK phosphorylation after 15 min of stimulation of CD8+ T cells isolated from the indicated mice with the indicated concentrations of anti-CD3 antibody was determined by flow cytometry. Data show the percentages CD8+ T cells that contained pERK, and are representative of three independent experiments. (B) In silico modeling. The abundance of DGKα, as determined by earlier Western blotting analysis, was assumed to be threefold greater than that of DGKζ. The extent of Ras activation after 15 min of TCR stimulation of WT, DGKζ−/−, and DGKα−/− T cells was determined by modeling under the following four conditions: (top left) when the catalytic rates and RasGRP1-binding rates of DGKζ and DGKα were the same; (bottom left) when the RasGRP1-binding rate of DGKζ was assumed to be threefold greater than that of DGKα, and the catalytic rates of DGKζ and DGKα were considered to be the same; (top right) when the catalytic rate of DGKζ was assumed to be sixfold greater than that of DGKα, and the RasGRP1-binding rates of both DGK isoforms were considered equal; and (bottom right) when the RasGRP1 binding rate of DGKζ was assumed to be threefold greater than that of DGKα, and the catalytic rate of DGKζ was sixfold greater than that of DGKα. “Signal” represents the signalosome that is formed after TCRs bind to peptide-MHC-linker of activated T cells (pMHC-LAT) complexes. The concentration of signal qualitatively relates to the concentration of the pMHC-TCR-LAT signalosome; therefore, larger concentrations of the species signal indicate larger doses of antigen. “Fraction activated” indicates the fraction of cells in which RasGTP concentrations were greater than one-third of the total Ras. (C) Measurement of the fold change in PA abundance in the indicated cells stimulated with anti-CD3 antibody for 7.5 min compared to that in unstimulated cells. *P < 0.05 as determined by one-way ANOVA with Tukey’s post-test on data from three independent experiments.

References

    1. Smith-Garvin JE, Koretzky GA, Jordan MS. T cell activation. Annu. Rev. Immunol. 2009;27:591–619. - PMC - PubMed
    1. Motto DG, Ross SE, Wu J, Hendricks-Taylor LR, Koretzky GA. Implication of the GRB2-associated phosphoprotein SLP-76 in T cell receptor-mediated interleukin 2 production. J. Exp. Med. 1996;183:1937–1943. - PMC - PubMed
    1. Imboden JB, Stobo JD. Transmembrane signalling by the T cell antigen receptor. Perturbation of the T3–antigen receptor complex generates inositol phosphates and releases calcium ions from intracellular stores. J. Exp. Med. 1985;161:446–456. - PMC - PubMed
    1. Tognon CE, Kirk HE, Passmore LA, Whitehead IP, Der CJ, Kay RJ. Regulation of RasGRP via a phorbol ester-responsive C1 domain. Mol. Cell. Biol. 1998;18:6995–7008. - PMC - PubMed
    1. Coudronniere N, Villalba M, Englund N, Altman A. NF-κB activation induced by T cell receptor/CD28 costimulation is mediated by protein kinase C-θ. Proc. Natl. Acad. Sci. U.S.A. 2000;97:3394–3399. - PMC - PubMed

Publication types

MeSH terms

Substances

LinkOut - more resources