

EMPeror: a tool for visualizing high-throughput microbial community data
- PMID: 24280061
- PMCID: PMC4076506
- DOI: 10.1186/2047-217X-2-16
EMPeror: a tool for visualizing high-throughput microbial community data
Abstract
Background: As microbial ecologists take advantage of high-throughput sequencing technologies to describe microbial communities across ever-increasing numbers of samples, new analysis tools are required to relate the distribution of microbes among larger numbers of communities, and to use increasingly rich and standards-compliant metadata to understand the biological factors driving these relationships. In particular, the Earth Microbiome Project drives these needs by profiling the genomic content of tens of thousands of samples across multiple environment types.
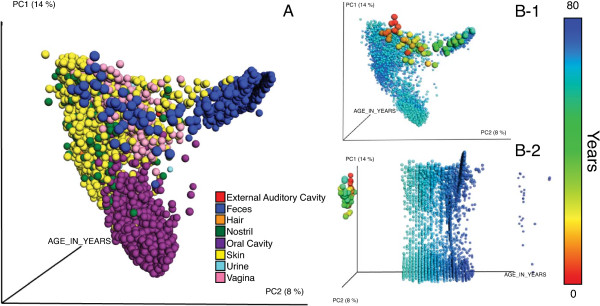
Findings: Features of EMPeror include: ability to visualize gradients and categorical data, visualize different principal coordinates axes, present the data in the form of parallel coordinates, show taxa as well as environmental samples, dynamically adjust the size and transparency of the spheres representing the communities on a per-category basis, dynamically scale the axes according to the fraction of variance each explains, show, hide or recolor points according to arbitrary metadata including that compliant with the MIxS family of standards developed by the Genomic Standards Consortium, display jackknifed-resampled data to assess statistical confidence in clustering, perform coordinate comparisons (useful for procrustes analysis plots), and greatly reduce loading times and overall memory footprint compared with existing approaches. Additionally, ease of sharing, given EMPeror's small output file size, enables agile collaboration by allowing users to embed these visualizations via emails or web pages without the need for extra plugins.
Conclusions: Here we present EMPeror, an open source and web browser enabled tool with a versatile command line interface that allows researchers to perform rapid exploratory investigations of 3D visualizations of microbial community data, such as the widely used principal coordinates plots. EMPeror includes a rich set of controllers to modify features as a function of the metadata. By being specifically tailored to the requirements of microbial ecologists, EMPeror thus increases the speed with which insight can be gained from large microbiome datasets.
Figures
References
-
- Harris R. The L4 time-series: the first 20 years. J Plankton Res. 2010;2:577–583. doi: 10.1093/plankt/fbq021. - DOI
