. 2013 Feb 4;1(1):7.
doi: 10.1186/2049-3002-1-7.

Metabolic changes in cancer cells upon suppression of MYC

Affiliations

Metabolic changes in cancer cells upon suppression of MYC

Elena Anso et al. Cancer Metab. .

Abstract

Background: Cancer cells engage in aerobic glycolysis and glutaminolysis to fulfill their biosynthetic and energetic demands in part by activating MYC. Previous reports have characterized metabolic changes in proliferating cells upon MYC loss or gain of function. However, metabolic differences between MYC-dependent cancer cells and their isogenic differentiated counterparts have not been characterized upon MYC suppression in vitro.

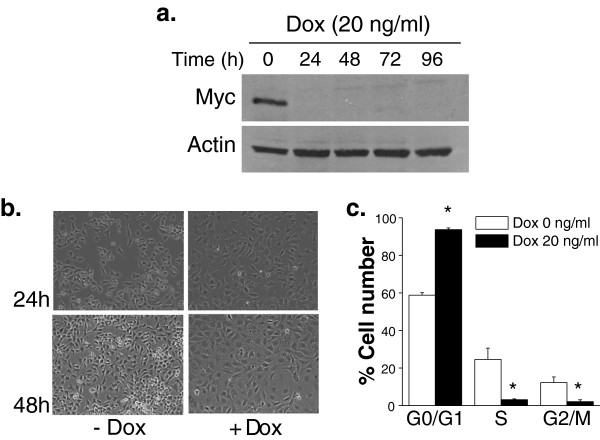
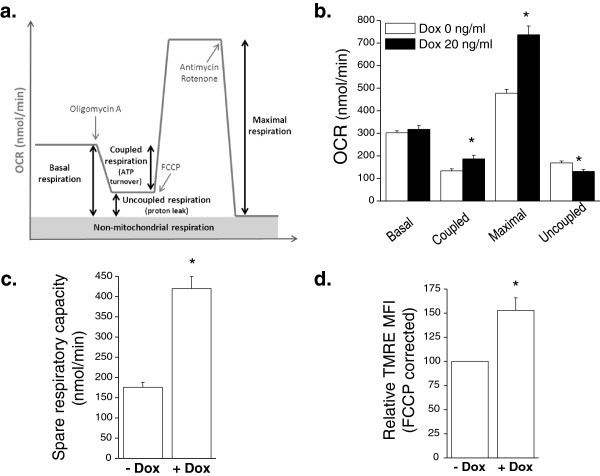
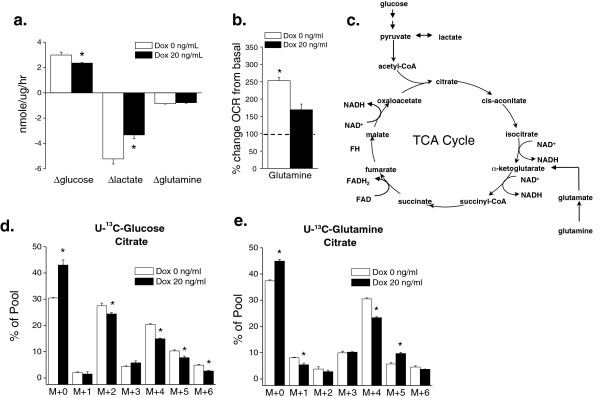
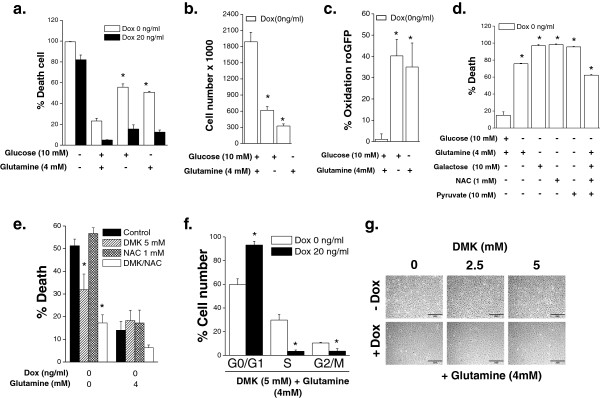
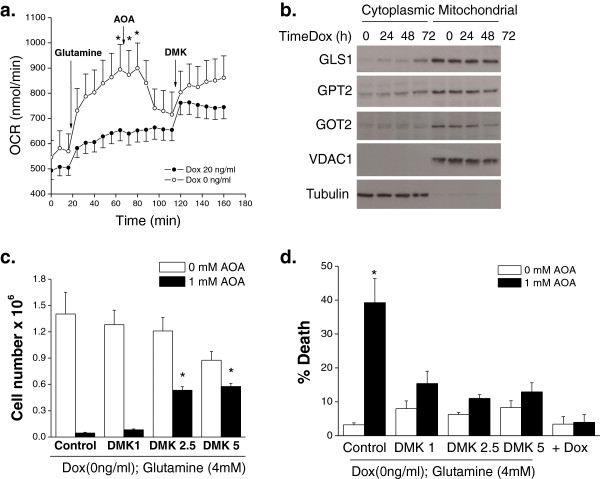
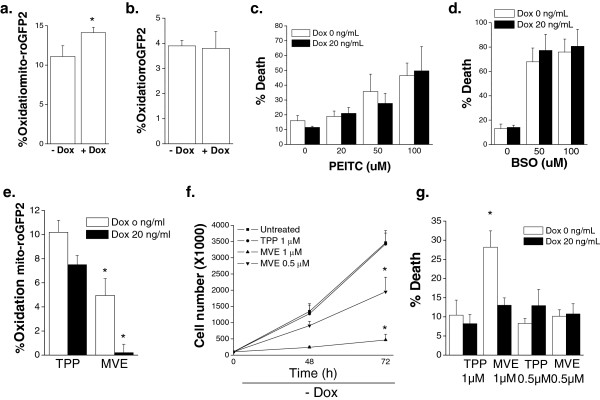
Results: Here we report metabolic changes between MYC-dependent mouse osteogenic sarcomas and differentiated osteoid cells induced upon MYC suppression. While osteogenic sarcoma cells increased oxygen consumption and spare respiratory capacity upon MYC suppression, they displayed minimal changes in glucose and glutamine consumption as well as their respective contribution to the citrate pool. However, glutamine significantly induced oxygen consumption in the presence of MYC which was dependent on aminotransferases. Furthermore, inhibition of aminotransferases selectively diminished cell proliferation and survival of osteogenic sarcoma MYC-expressing cells. There were minimal changes in ROS levels and cell death sensitivity to reactive oxygen species (ROS)-inducing agents between osteoid cells and osteogenic sarcoma cells. Nevertheless, the mitochondrial-targeted antioxidant Mito-Vitamin E still diminished proliferation of MYC-dependent osteogenic sarcoma cells.

Conclusion: These data highlight that aminotransferases and mitochondrial ROS might be attractive targets for cancer therapy in MYC-driven tumors.


Figures

Figure 1
Figure 1
Osteogenic sarcoma cells differentiate into mature osteocytes under MYC suppression. (a) MYC protein levels in osteogenic sarcoma cells treated with doxycycline (20 ng/mL) at 24, 48, 72 and 96 hours. (b) Phase contrast microscopy pictures of osteogenic sarcoma cells after 24 and 48 hours treatment with doxycycline (20 ng/mL). (c) Cell cycle analysis was performed by staining the cells with propidium iodide (PI) after 48 hours doxycycline (20ng/ml) treatment. N = 4 ± SEM * P < 0.05 compared to 0 ng/ml doxycycline.
Figure 2
Figure 2
Bioenergetic profiles of osteocytes and MYC-dependent osteogenic sarcoma cells. (a) Oxygen consumption rate (OCR) was determined using a Seahorse Bioscience XF24 Flux Analyzer by sequential injection of oligomycin, FCCP and antimycin A/rotenone. (b) Basal, coupled, maximal, and uncoupled oxygen consumption rate (OCR) was assessed in osteogenic sarcoma cells in the presence or absence of 20 ng/mL doxycycline for 48 hours. N = 6 ± SEM * P < 0.05 compared to 0 ng/ml doxycycline. (c) Spare respiratory capacity defined as maximal respiration minus basal respiration. N = 6 ± SEM * P < 0.05 compared to 0 ng/ml doxycycline. (d) Mitochondrial membrane potential as assessed by TMRE mean fluorescence intensity (MFI), corrected by FCCP. N = 5 ± SEM * P<0.05 compared to 0 ng/ml doxycycline.
Figure 3
Figure 3
Glucose and glutamine-dependent metabolism in osteocytes and MYC- dependent osteogenic sarcoma cells. Doxycycline (20 ng/mL) was added to MYC- dependent osteogenic sarcoma cells and incubated for 48 hours. (a) Glucose and glutamine consumption along with lactate production was measured at six hours. N = 3 ± SEM * P<0.05 compared to 0 ng/ml doxycycline. (b) Cells were incubated in glutamine-free media for one hour. OCR was determined by injection of glutamine (4 mM). N = 5 ± SEM * P<0.05 compared to 20 ng/ml doxycycline. (c) Glucose and glutamine carbons feed into the TCA cycle. (d) and (e) Doxycycline was added to cells (0 or 20 ng/mL) and incubated for 48 hours and then labeled for six hours with either U13-Glucose or U13-Glutamine and subsequently citrate pools were examined. N = 3 ± SEM * P<0.05 compared to 0 ng/ml doxycycline.
Figure 4
Figure 4
MYC-dependent osteogenic sarcoma cells are dependent on glucose and glutamine for survival. Doxycycline (20 ng/mL) was added to MYC-dependent osteogenic sarcoma cells and incubated for 48 hours. Subsequently, cells were placed in complete media or in media depleted of glucose, glutamine or both. (a) Cell death was assessed after 48 hours. N = 3 ± SEM * P < 0.05 compared to media containing both glucose and glutamine. (b) Cell number was assessed after 24 hours. N = 3 ± SEM * P < 0.05 compared to media containing both glucose and glutamine. (c) Cytosolic ROS was measured after 24 hours using roGFP2. N = 4 ± SEM * P < 0.05 compared to media containing both glucose and glutamine. (d) Cell death was assessed in osteogenic sarcoma cells depleted with glutamine and supplemented with galactose (10 mM), pyruvate (5 mM) and/or NAC (1 mM). N = 3 ± SEM * P < 0.05 compared to media containing both glucose and glutamine. (e) Cell death was assessed in osteogenic sarcoma cells depleted with glutamine and supplemented with DMK (5 mM) and/or NAC (1 mM). N = 4 ± SEM * P < 0.05 compared to media containing no glucose and no glutamine. (f) Cell cycle analysis at 48 hours in osteogenic sarcoma cells simultaneously treated with DMK and doxycycline. N = 3 ± SEM * P < 0.05 compared to 0 ng/ml doxycycline. (g) Phase contrast microscopy pictures of osteogenic sarcoma cells treated with DMK (0–5 mM), glutamine (4 mM) and doxycycline.
Figure 5
Figure 5
MYC-dependent osteogenic sarcoma cells are dependent on aminotransferases. Doxycycline (20 ng/mL) was added to MYC-dependent osteogenic sarcoma cells and incubated for 48 hours. (a) Cells were incubated without glutamine for one hour. OCR was measured and subsequently after the addition of glutamine (4 mM) followed by AOA (1 mM) and DMK (5 mM). N = 7 ± SEM * P < 0.05 compared to no glutamine. (b) Protein expression of GLS1, GPT2, and GOT2 in mitochondrial and cytoplasmic fractions in cells treated with doxycycline. VDAC1 and tubulin are loading controls for mitochondrial and cytosolic fractions, respectively. (c) Cell proliferation was assessed after 48 hours treatment with AOA (1 mM). N = 3 ± SEM * P < 0.05 compared to 0 mM DMK with 1 mM AOA. (d) Cell death assessed after 48 hours of treatment with AOA (1 mM) in the presence of DMK (0–5 mM). N = 6 (control condition) and N = 3 (for experimental conditions) ± SEM * P < 0.05 compared to 0 mM AOA.
Figure 6
Figure 6
MYC-dependent osteogenic sarcoma cells are dependent on mitochondrial ROS for cell proliferation. Doxycycline (20 ng/mL) was added to MYC-dependent osteogenic sarcoma cells and incubated for 48 hours. (a) Mitochondrial ROS was assessed using oxidation of mitochondrial targeted roGFP2. N = 4 ± SEM * P<0.05 compared to without doxycycline. (b) Cytosolic ROS was assessed using oxidation of cytosolic roGFP2. N = 4 ± SEM. (c) Cells were treated with PEITC (0 to 100 μM) for 24 hours and cell death was measured. N = 4 ± SEM. (d) Cells were treated with BSO (0 to 100 uM) for 24 hours and cell death was measured. N = 4 ± SEM (e) Mitochondrial ROS as assessed by mito-roGFP2 in cells treated with control TPP (0.5 μM) or mitochondrial targeted vitamin E (MVE 0.5 μM). N = 6 ± SEM * P<0.05 compared to TPP control. (f) Cell proliferation was assessed upon treatment with TPP (1 μM) or MVE (0.5 or 1 μM) for 48 and 72 hours. N = 3 ± SEM * P<0.05 compared to 1 mM TPP control. (g) Cell death was assessed after 48 hours of treatment with TPP or MVE. N = 4 ± SEM * P<0.05 compared to 1 mM TPP control without doxycycline.

References

    1. Vander Heiden MG, Cantley LC, Thompson CB. Understanding the Warburg effect: the metabolic requirements of cell proliferation. Science. 2009;324(5930):1029–1033. doi: 10.1126/science.1160809. - DOI - PMC - PubMed
    1. Lunt SY, Vander Heiden MG. Aerobic glycolysis: meeting the metabolic requirements of cell proliferation. Annu Rev Cell Dev Biol. 2011;27:441–464. doi: 10.1146/annurev-cellbio-092910-154237. - DOI - PubMed
    1. DeBerardinis RJ, Lum JJ, Hatzivassiliou G, Thompson CB. The biology of cancer: metabolic reprogramming fuels cell growth and proliferation. Cell Metab. 2008;7(1):11–20. doi: 10.1016/j.cmet.2007.10.002. - DOI - PubMed
    1. DeBerardinis RJ, Cheng T. Q’s next: the diverse functions of glutamine in metabolism, cell biology and cancer. Oncogene. 2010;29(3):313–324. doi: 10.1038/onc.2009.358. - DOI - PMC - PubMed
    1. Levine AJ, Puzio-Kuter AM. The control of the metabolic switch in cancers by oncogenes and tumor suppressor genes. Science. 2010;330(6009):1340–1344. doi: 10.1126/science.1193494. - DOI - PubMed

LinkOut - more resources