. 2014 Jan 17;289(3):1329-44.
doi: 10.1074/jbc.M113.529065. Epub 2013 Nov 26.

Proteome analysis and conditional deletion of the EAAT2 glutamate transporter provide evidence against a role of EAAT2 in pancreatic insulin secretion in mice

Affiliations

Proteome analysis and conditional deletion of the EAAT2 glutamate transporter provide evidence against a role of EAAT2 in pancreatic insulin secretion in mice

Yun Zhou et al. J Biol Chem. .

Abstract

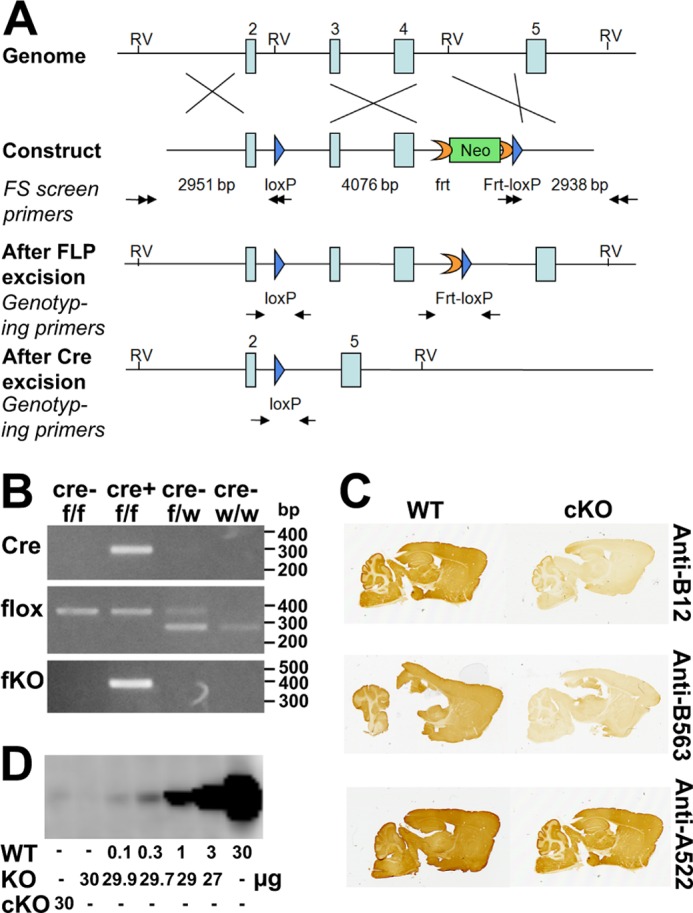
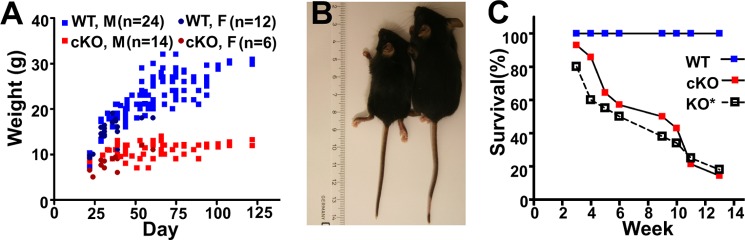
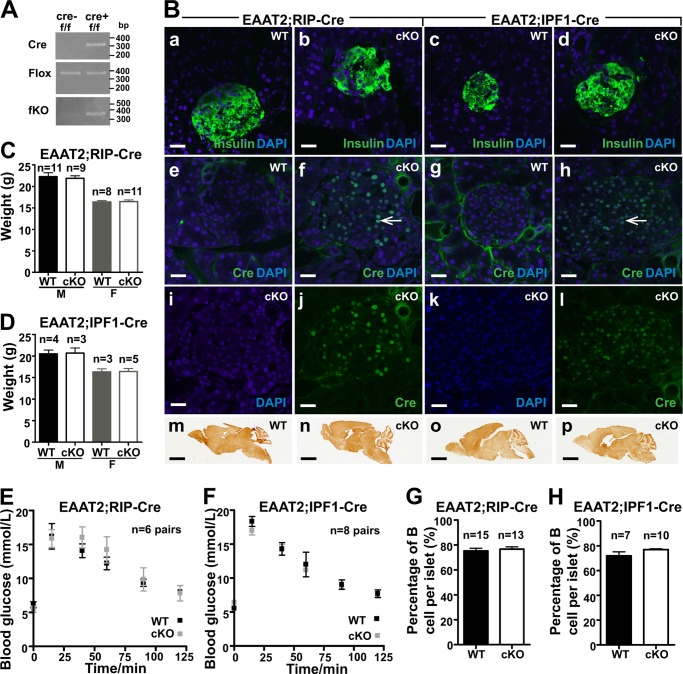
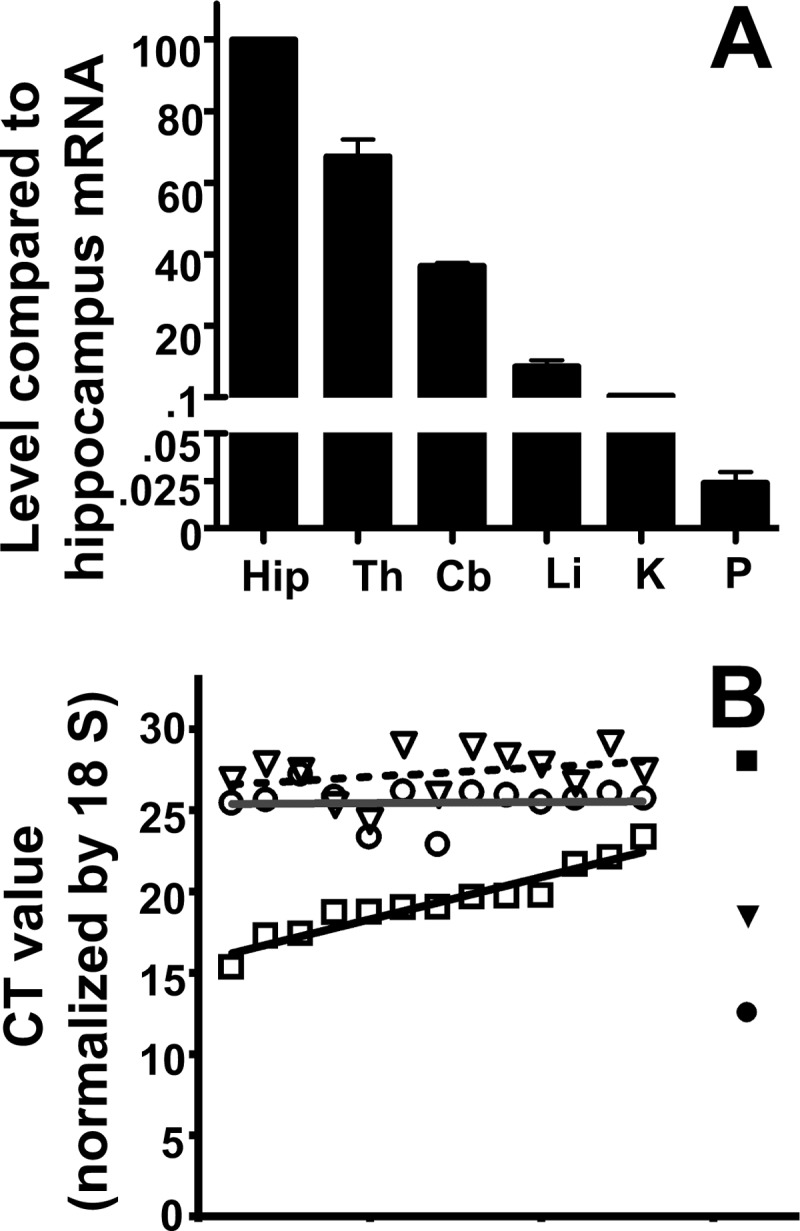
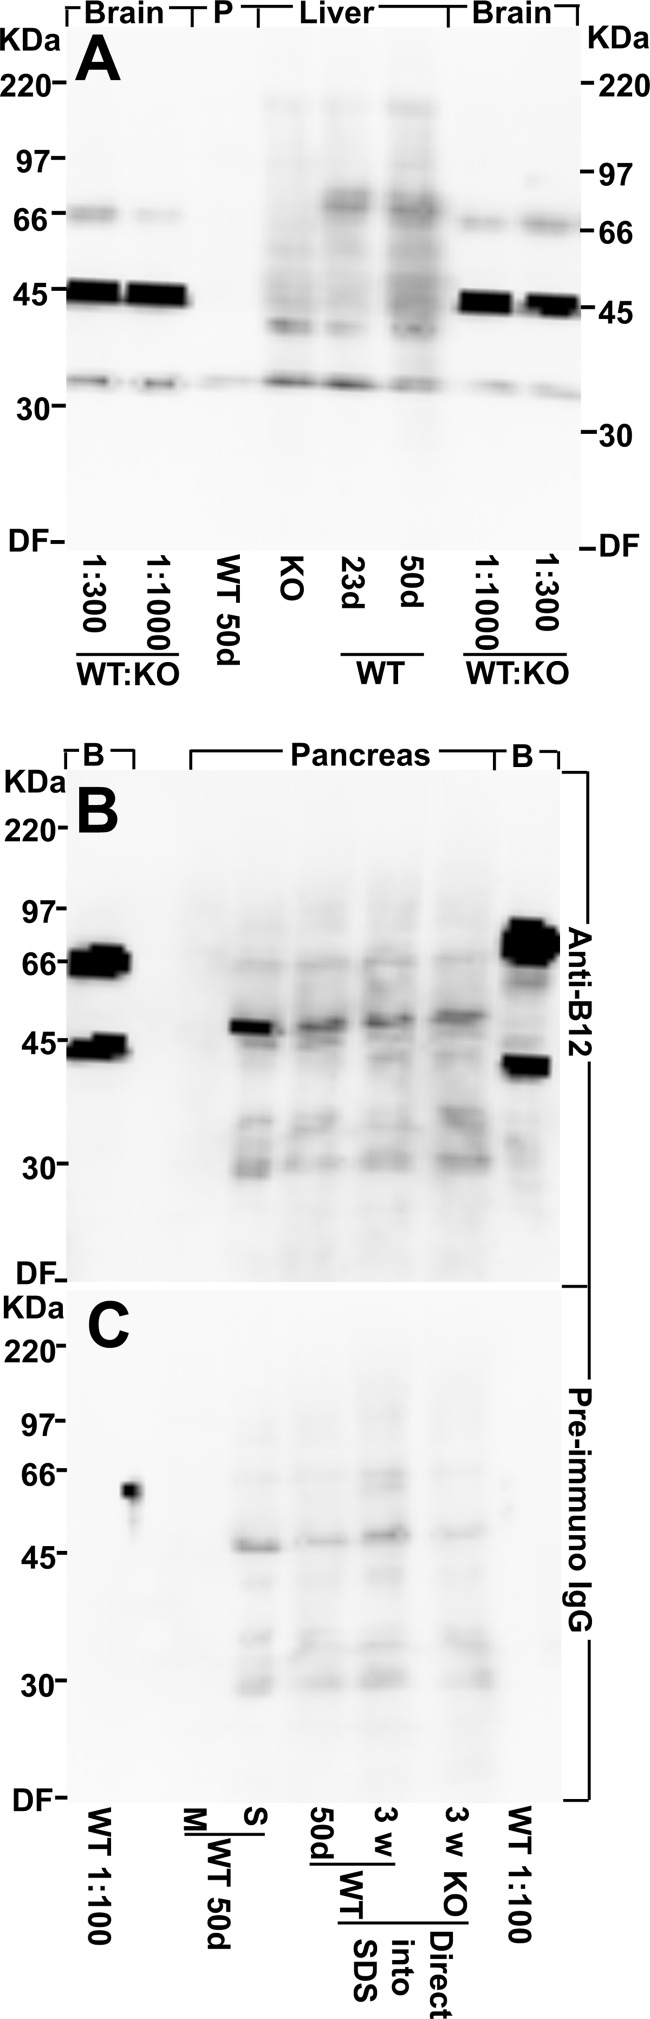
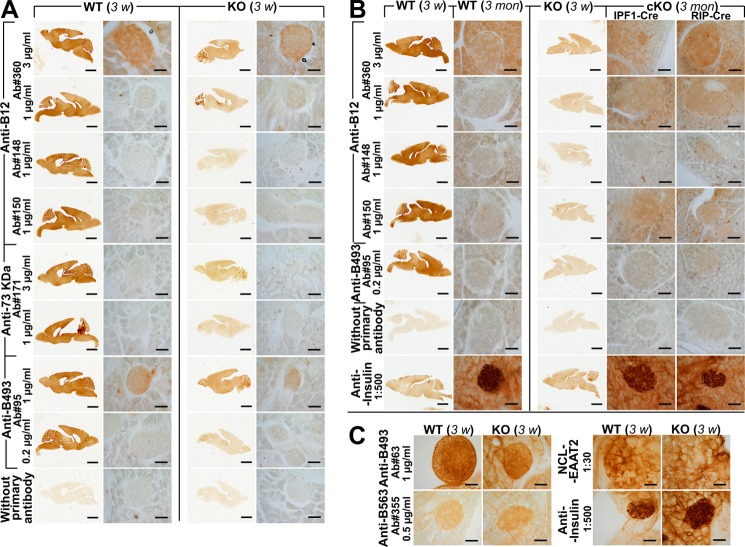
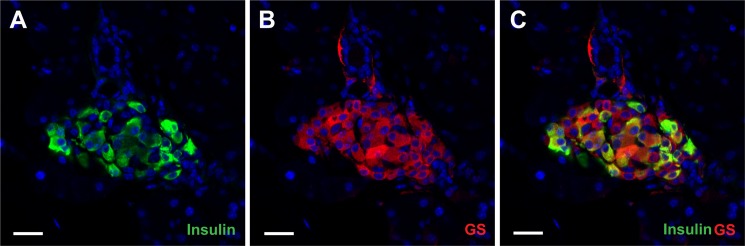
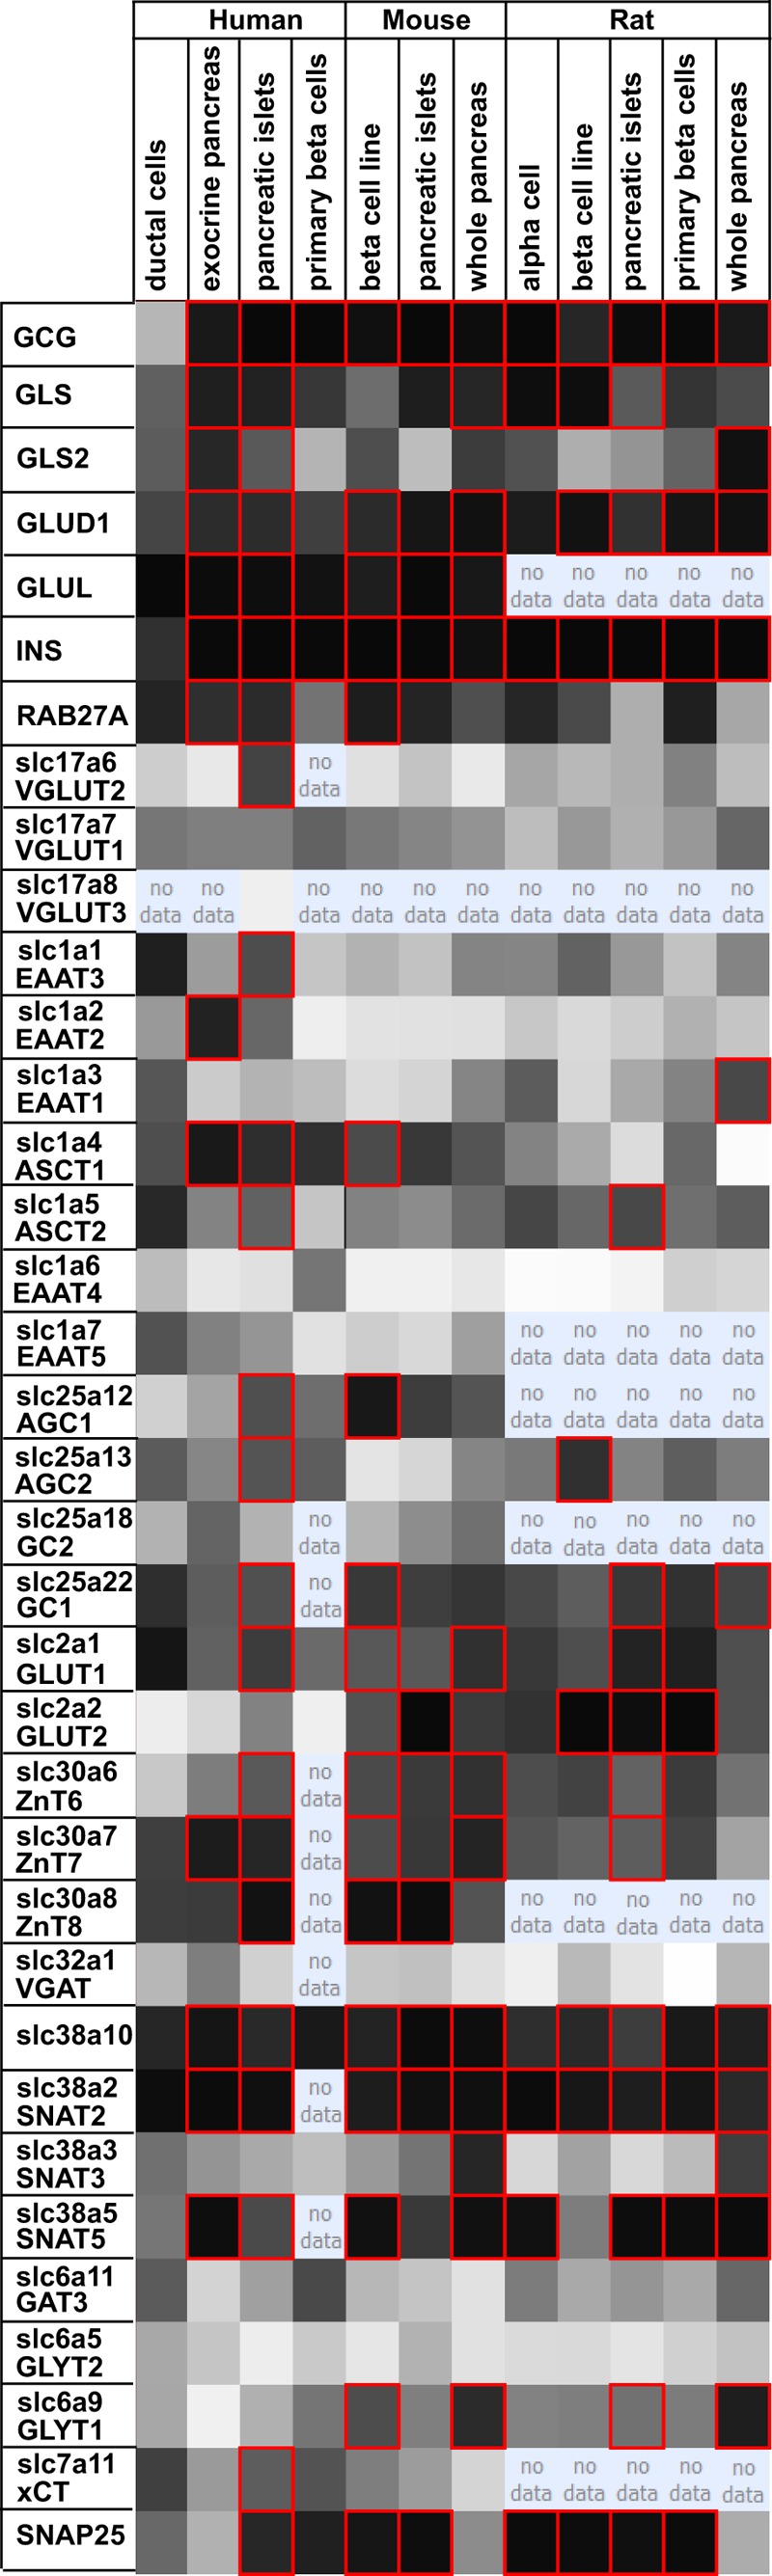
Islet function is incompletely understood in part because key steps in glutamate handling remain undetermined. The glutamate (excitatory amino acid) transporter 2 (EAAT2; Slc1a2) has been hypothesized to (a) provide islet cells with glutamate, (b) protect islet cells against high extracellular glutamate concentrations, (c) mediate glutamate release, or (d) control the pH inside insulin secretory granules. Here we floxed the EAAT2 gene to produce the first conditional EAAT2 knock-out mice. Crossing with Nestin-cyclization recombinase (Cre) eliminated EAAT2 from the brain, resulting in epilepsy and premature death, confirming the importance of EAAT2 for brain function and validating the genetic construction. Crossing with insulin-Cre lines (RIP-Cre and IPF1-Cre) to obtain pancreas-selective deletion did not appear to affect survival, growth, glucose tolerance, or β-cell number. We found (using TaqMan RT-PCR, immunoblotting, immunocytochemistry, and proteome analysis) that the EAAT2 levels were too low to support any of the four hypothesized functions. The proteome analysis detected more than 7,000 islet proteins of which more than 100 were transporters. Although mitochondrial glutamate transporters and transporters for neutral amino acids were present at high levels, all other transporters with known ability to transport glutamate were strikingly absent. Glutamate-metabolizing enzymes were abundant. The level of glutamine synthetase was 2 orders of magnitude higher than that of glutaminase. Taken together this suggests that the uptake of glutamate by islets from the extracellular fluid is insignificant and that glutamate is intracellularly produced. Glutamine synthetase may be more important for islets than assumed previously.

Keywords: Excitatory Amino Acid Transporter; Glutamate Uptake; Glutamine Synthase; Immunohistochemistry; Insulin Secretion; Pancreatic Islets; Proteomics; Slc1a2; Transgenic Mice; VGLUT3.


Figures

FIGURE 1.
FIGURE 1.
Generation and verification of the EAAT2-flox mice. A, generation of the EAAT2-flox mice. The gene-targeting construct contained exons 2–5 of the EAAT2 (Slc1a2) gene. A loxP sequence (blue arrow) was inserted into intron 2. An frt-PGKneo-frt-loxP cassette was inserted into intron 4, and an endogenous EcoRV (RV) site was deleted. The lengths of the homologous arms and of the floxed fragment are indicated below the construct. The black double arrows indicate the positions of the primers used for ES cell screening. The neomycin (Neo) cassette was removed in the EAAT2-flox mice generated from chimera × Rosa26FLP crossing. The genotyping primers are indicated by black arrows in the “After FLP excision” and “After Cre excision.” After Cre excision, the DNA encoding amino acid residues 53–187 is deleted. This region is essential for transport activity, and there will be no transport activity without it. Furthermore, the deletion causes the remaining sequences to be out of frame. B, PCR of genomic DNA of the brains from homozygote (f/f) or heterozygote (f/w) EAAT2-flox without (Cre−) or with (Cre+) Nestin11-Cre. PCR was performed to detect Cre, flox (loxP sites), and the recombination after Cre excision (fKO) as indicated. Note that when Cre is present the fKO allele emerges. Also note that the wild-type allele has lower molecular mass than the floxed allele, explaining why the there are two band in the heterozygous animals. C, peroxidase labeling of parasagittal brain sections from EAAT2-flox (WT) and conditional knock-out (cKO) mice with antibodies to the N terminus (Anti-B12; Ab360; 0.3 μg/ml) and the C terminus (Anti-B563; Ab355; 0.1 μg/ml) of EAAT2. Anti-A522 antibodies (Ab314; 0.1 μg/ml) to the C-terminal part of EAAT1 were used as a positive control. D, immunoblot analysis of the wild-type (WT) and conditional knock-out forebrain membrane fractions with antibodies to EAAT2 (Anti-B12; Ab360; 0.2 μg/ml). The WT tissue extracts were diluted in extracts from the conventional knock-out (KO) (27) to keep the total amount of protein constant at 30/per lane. Note that 30 μg from cKO gave a signal that was slightly weaker than that obtained after 1:300 dilution of the WT extract with KO extract.
FIGURE 2.
FIGURE 2.
Phenotypes of brain-selective (EAAT2-flox × Nestin11-Cre) conditional knock-out mice. A, the body weights of EAAT2-flox mice (WT; 24 males and 12 females) and their littermates (cKO; 14 males and six females) were measured at different ages. Note that the body weights of the cKO mice stopped increasing after 3 weeks of age. B and C, the wild-type (EAAT2-flox) mice were larger than the brain-selective conditional knock-out mice. This was also apparent from the organs. D, the survival of the cKO mice was poor. The data are from 18 pairs of WT (EAAT2-flox) and cKO (EAAT2-flox × Nestin11-Cre) littermates. Published data (27) on the conventional knock-out (KO*) were plotted for comparison. It is not known whether the difference between the cKO and the KO is real or due to variations in the genetic background.
FIGURE 3.
FIGURE 3.
Characterization of EAAT2-flox mice crossed with Cre lines (RIP-Cre and IPF1-Cre) causing pancreas-selective excision. A, PCR of genomic DNA of the pancreas from homozygote (f/f) EAAT2-flox without (cre−) or with (cre+) either RIP-Cre or IPF1-Cre as indicated. Note that the fKO allele becomes detectable when Cre is present. This shows that the recombination indeed takes place. B, confocal microscopy images of pancreas sections from WT (EAAT2-flox) or cKO (either EAAT2-flox × RIP-Cre or EAAT2-flox × IPF1-Cre as indicated) labeled with antibodies either to Cre (green; 1:200) or to insulin (green; 1:500) as indicated. Note the multiple Cre-positive nuclei (panels f, j, h, and l). Arrows in f and g point to a few of them. The sections were mounted in a DAPI-containing medium to visualize cell nuclei (blue). Note that insulin was readily detectable in all sections (panels a–d), whereas Cre was only detectable in islet cells in Cre-positive (cKO) mice (panels j and i), attesting to the specificity of the antibodies. Panels e, f, g and h are merged images showing both DAPI and Cre. Panels i and j are merged to give f, and k and l are merged to give h. Also note that EAAT2 was present in the brains of both WT and cKO mice (panels m–p) as indicated. Immunoperoxidase labeling of parasagittal brain sections was carried out with anti-B563 (Ab355; 0.1 μg/ml) antibody to the C terminus of EAAT2. Scale bars, 20 μm (pancreas) and 2 mm (brain). C and D, body weights of EAAT2-flox mice (WT) and cKO mice as indicated. The mice in C were 6–7 weeks old, whereas those in D were 5–6 weeks old (M, male; F, female). E and F, glucose tolerance tests of the male WT and cKO from RIP-Cre (E) and IPF1-Cre (F). Note that WT (EAAT2-flox) and cKO have similar glucose tolerance. G and H, the percentages of insulin-positive cells in the islet were the same in EAAT2-flox mice (WT) and their cKO littermates. Error bars, S.E.
FIGURE 4.
FIGURE 4.
The levels of EAAT2 and VGLUT3 mRNAs are very low. A, TaqMan real time PCR was used to compare the levels of EAAT2 mRNA in brain regions (Hip, hippocampus; Th, thalamus; Cb, cerebellum) with those in liver (Li), kidney (K), and whole pancreas (P). The tissues were collected from three 6–9-week-old mice. Data were normalized to 18 S mRNA levels determined by RT-PCR. Note that the EAAT2 mRNA levels in the liver and in the whole pancreas were 10 and 4000 times lower, respectively, than in the hippocampus. B, multiple small pieces (less than 1 mg) of pancreatic tissue were collected from the body of pancreas. The levels of mRNAs encoding VGLUT3 (open triangles), EAAT2 (open circles), and glucagon (open squares) were determined, and the data (cycle threshold (CT) values) were sorted and plotted according to glucagon levels. Consequently, the graph shows increasing glucagon levels. Hippocampus was used as a control (solid symbols). Note that the EAAT2 levels in the pancreas did not correlate with the glucagon levels (the line is horizontal). Also note that the cycle threshold values for VGLUT3 in the pancreas are similar to those of glucagon in the hippocampus, indicating that VGLUT3 is close to transcription background (higher cycle threshold values means lower mRNA levels as the cycle threshold values represent the number of PCR cycles needed to reach the detection threshold). The tissues were collected from 6–7-week-old mice. The data are from two independent experiments.
FIGURE 5.
FIGURE 5.
Western blots show that there is very little, if any, EAAT2 protein in pancreas. A, EAAT2 protein is detectable by immunoblotting in brain and liver but not in pancreas (P). Various tissues from a 50-day-old (50d) male WT mouse and from 23-day-old (23d) conventional EAAT2 KO and WT littermates were collected, homogenized in water with protease inhibitors (see “Experimental Procedures”), and centrifuged. The pellets (the water-insoluble fraction containing cell membranes) were extracted with SDS. The WT forebrain extract (50 days old) was diluted 300 or 1,000 times as indicated in the KO forebrain extract. Note that EAAT2 is detectable in the diluted WT brain extracts and in the WT liver extracts (both 23 and 50 days old) but not in the extracts from pancreas (50 days old) or in the KO liver extract. The band representing EAAT2 is the one just above the 66-kDa marker, whereas the strong 45-kDa band seen in the brain samples is due to a cross-reacting compound. The latter is strong relative to EAAT2 because it is present in both the WT and the KO extract and thereby not diluted like EAAT2. The total protein loaded in each lane was 30 μg. The blot was developed with EAAT2 anti-B12 antibodies (Ab360; 0.2 μg/ml). B, pancreas contains water-soluble proteins that bind the antibodies, and these unidentified proteins have a molecular mass similar to that of EAAT2. Pancreas from a 50-day-old WT mouse was homogenized in water with protease inhibitors (see “Experimental Procedures”) and centrifuged to separate the water-soluble (S) proteins from the membrane fraction (M). Note that there is no labeling in the lane containing the pancreas membrane fraction. All of the labeling is due to the water-soluble components. In agreement, there is similar labeling when whole pancreas (50-day-old WT, 23-day-old WT, and 23-day-old KO) were directly solubilized in SDS. The membrane fraction from WT forebrain (50 days old) diluted 1:100 with KO forebrain extract (B) was used as a positive control (the lanes on each side of the blot as indicated). Note that the 66-kDa band representing EAAT2 is stronger relative to the cross-reacting 45-kDa band than in A due to less dilution. The blot was developed with EAAT2 anti-B12 antibodies (Ab360; 0.2 μg/ml). C, a blot identical to that in B was developed with normal (preimmune) IgG (0.2 μg/ml). Note that the extracts from whole pancreas and from the water-soluble fraction contain proteins that tend to bind IgG in general. In particular, there is weak labeling of a band that can easily be mistaken for EAAT2 when high sensitivity detection systems are used. DF, dye front.
FIGURE 6.
FIGURE 6.
EAAT2 was neither detectable in islets from 3-week-old mice nor from 3-month-old mice with standard immunoperoxidase technique. A and C, brain and pancreas sections from 3-week (3 w)-old conventional EAAT2 KO (27) mice and their WT littermates were labeled with eight different anti-EAAT2 antibodies (Table 2) as indicated. The brain sections were developed together with the pancreas sections as positive and negative controls, respectively. Anti-insulin antibodies were used as a positive control for islets. Note that there were no differences between the WT and KO mice. B, similar labeling experiments were also done using the same antibodies and pancreas sections from 3-month (3 mon)-old mice (WT). Tissue from both cKO (IPF1-Cre and RIP-Cre as indicated) and conventional KOs were included as negative controls. Note that EAAT2 was also undetectable in islets at 3 months. Scale bars, 2 mm (brain) and 50 μm (pancreas).
FIGURE 7.
FIGURE 7.
A, electron micrograph from a wild-type mouse islet showing a β-cell containing secretory granules (g). Mitochondria (m) and nucleus (Nu) are indicated. B, higher magnification of granular vesicles. Mice (6–10 weeks old) were perfusion-fixed with 1.5% formaldehyde and 2.5% glutaraldehyde in 0.1 m sodium phosphate buffer, pH 7.4. Scale bar, 2 μm.
FIGURE 8.
FIGURE 8.
Confocal images show glutamine synthethase (GS; red; B) and insulin (green; A) distributions in young adult mouse pancreas. C is a merged image showing both glutamine synthethase and insulin. The islets were strongly labeled with anti-glutamine synthethase antibodies (Sigma G2781; 1:1,000), whereas the exocrine pancreas was virtually unlabeled in agreement with the proteome data (Table 3). Within islets the glutamine synthethase labeling was not restricted to one cell type as glutamine synthethase immunoreactivity was prominent in both insulin-positive and insulin-negative cells (anti-insulin antibody, Sigma I2018; 1:500). Furthermore, the intensity of the glutamine synthethase labeled was highly variable. Scale bar, 20 μm.
FIGURE 9.
FIGURE 9.
Transcriptome data do not support the notion that glutamate transporters are concentrated in islets. The figure shows a screen shot from the Beta Cell Gene Atlas (90), which contains data on basal expression of genes in different β-cell sources (pancreatic β-cells, islets, whole pancreas, and β-cell lines) from human, mouse, and rat. This database was searched for expression levels of some neurotransmitter transporters previously reported to be enriched in islets and compared with glucose transporters (GLUT1 and GLUT2) and proteins involved in exocytosis (e.g. Rab27) as well as three enzymes involved in glutamate metabolism (GLS, glutaminase; GLUD1, glutamate dehydrogenase; GLUL, glutamine synthetase). Glucagon (gcg) and insulin (INS) are shown for comparison. The latter are expressed at such high levels that they are detected in all samples due to contamination. The darker the cell color, the higher the expression levels. Genes expressed with a probability score of 0.95 or higher are designated with a red border. The column “human pancreatic islet massively parallel signature sequencing” is not shown as it did not contain data on the transcripts that were the focus of this study.

Similar articles

Cited by

References

    1. Moriyama Y., Hayashi M. (2003) Glutamate-mediated signaling in the islets of Langerhans: a thread entangled. Trends Pharmacol. Sci. 24, 511–517 - PubMed
    1. MacDonald M. J., Fahien L. A. (2000) Glutamate is not a messenger in insulin secretion. J. Biol. Chem. 275, 34025–34027 - PubMed
    1. Yamada S., Komatsu M., Sato Y., Yamauchi K., Aizawa T., Hashizume K. (2001) Glutamate is not a major conveyer of ATP-sensitive K+ channel-independent glucose action in pancreatic islet β cell. Endocr. J. 48, 391–395 - PubMed
    1. Bertrand G., Ishiyama N., Nenquin M., Ravier M. A., Henquin J.-C. (2002) The elevation of glutamate content and the amplification of insulin secretion in glucose-stimulated pancreatic islets are not causally related. J. Biol. Chem. 277, 32883–32891 - PubMed
    1. Jitrapakdee S., Wutthisathapornchai A., Wallace J. C., MacDonald M. J. (2010) Regulation of insulin secretion: role of mitochondrial signalling. Diabetologia 53, 1019–1032 - PMC - PubMed

Publication types