. 2014 Jan 3;289(1):264-74.
doi: 10.1074/jbc.M113.495499. Epub 2013 Nov 26.

Paradoxical abatement of striatal dopaminergic transmission by cocaine and methylphenidate

Affiliations

Paradoxical abatement of striatal dopaminergic transmission by cocaine and methylphenidate

Mauro Federici et al. J Biol Chem. .

Abstract

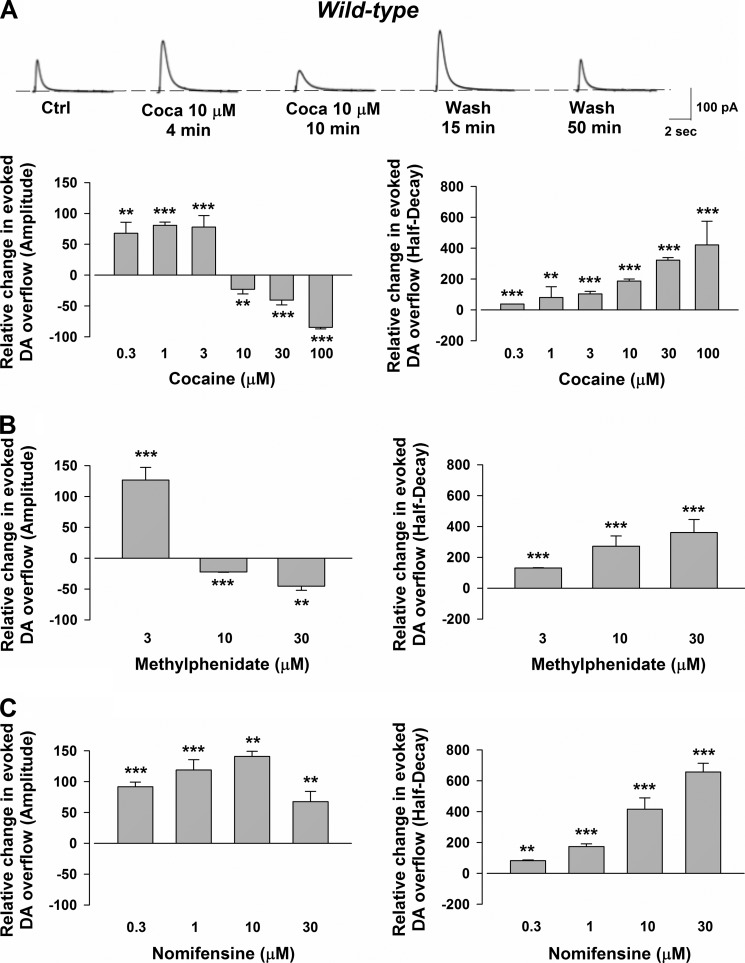
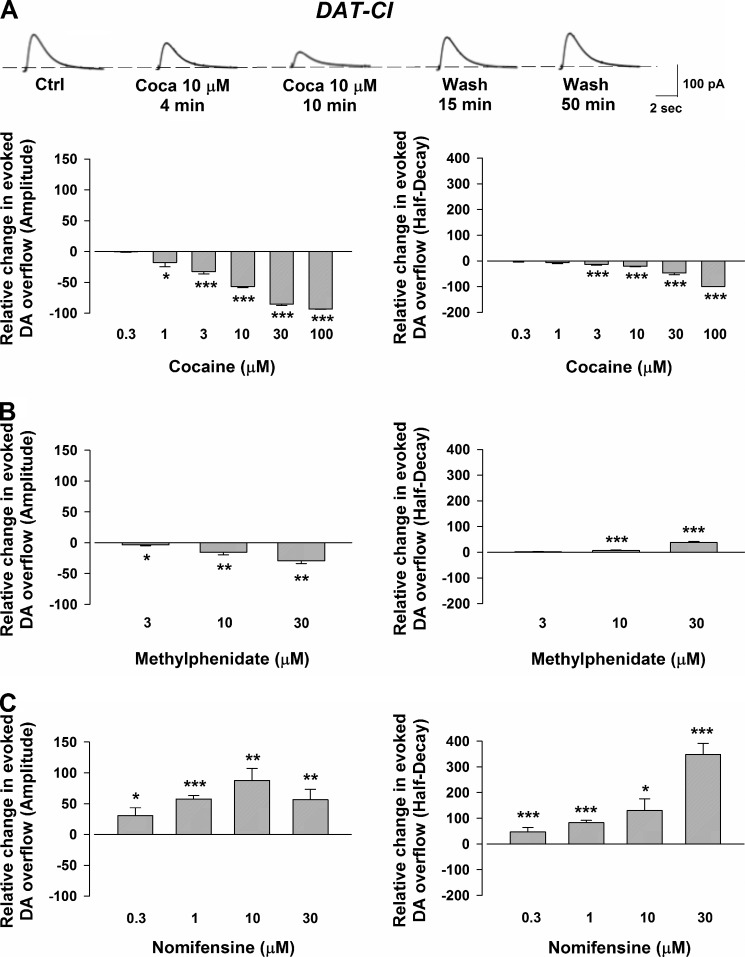
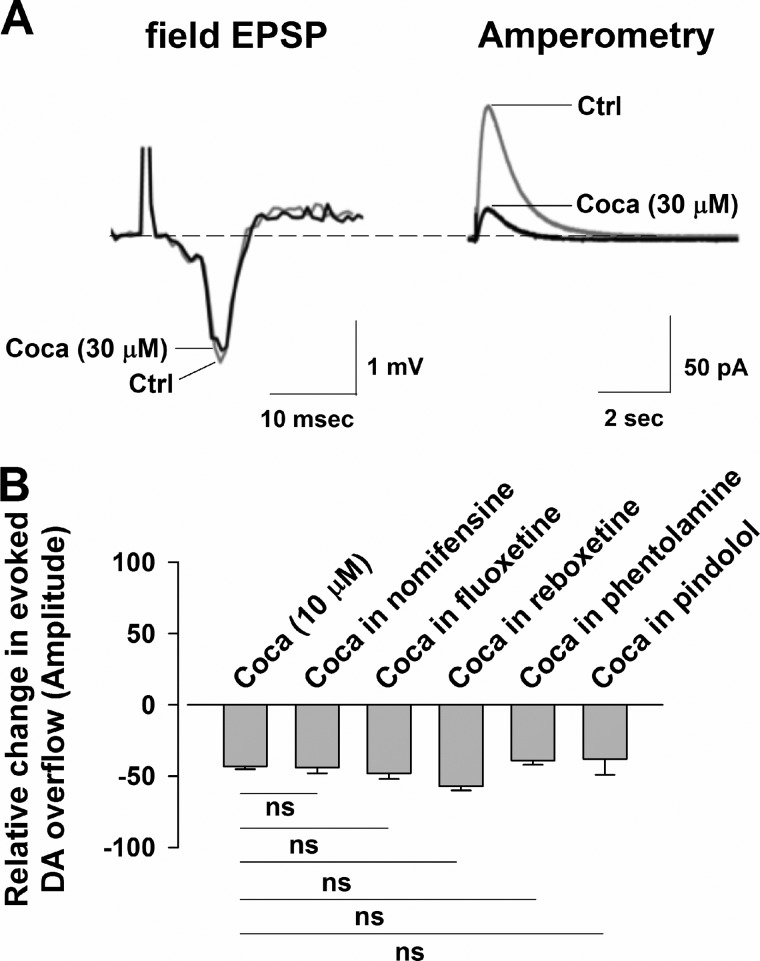
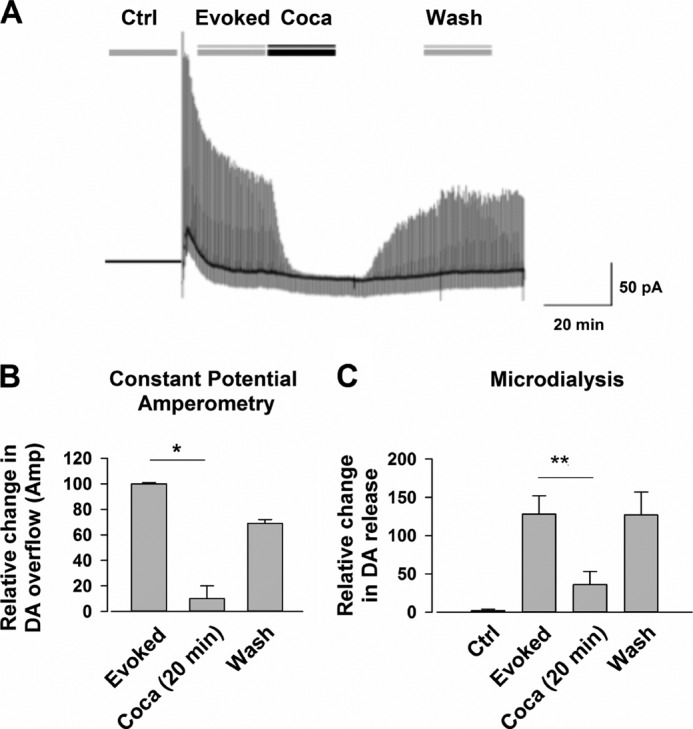
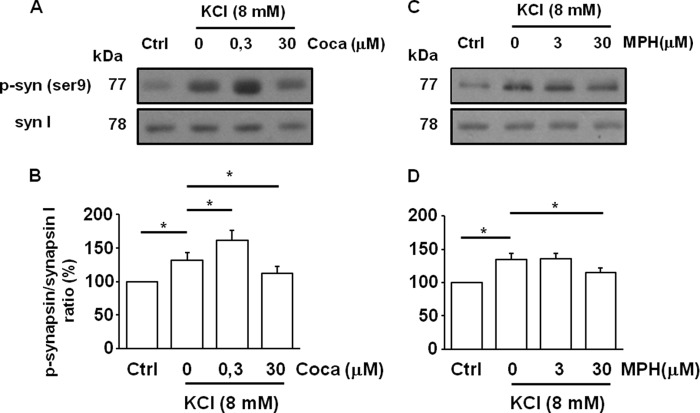
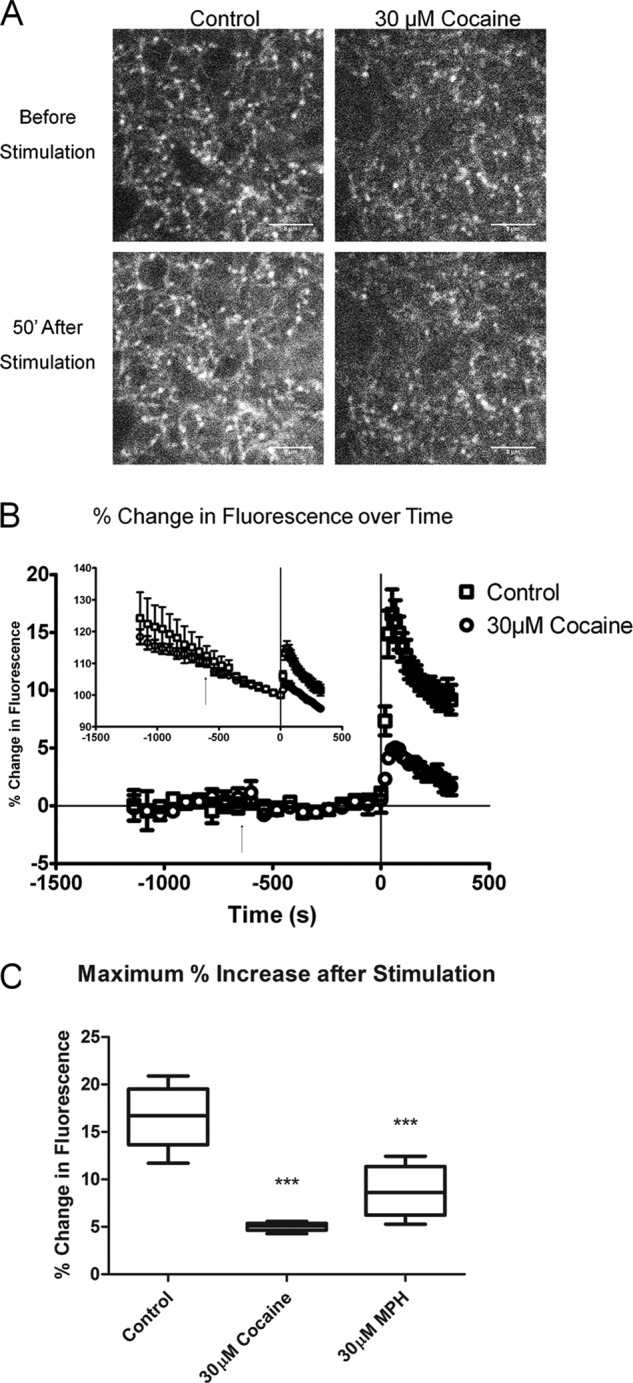
We combined in vitro amperometric, optical analysis of fluorescent false neurotransmitters and microdialysis techniques to unveil that cocaine and methylphenidate induced a marked depression of the synaptic release of dopamine (DA) in mouse striatum. In contrast to the classical dopamine transporter (DAT)-dependent enhancement of the dopaminergic signal observed at concentrations of cocaine lower than 3 μM, the inhibitory effect of cocaine was found at concentrations higher than 3 μM. The paradoxical inhibitory effect of cocaine and methylphenidate was associated with a decrease in synapsin phosphorylation. Interestingly, a cocaine-induced depression of DA release was only present in cocaine-insensitive animals (DAT-CI). Similar effects of cocaine were produced by methylphenidate in both wild-type and DAT-CI mice. On the other hand, nomifensine only enhanced the dopaminergic signal either in wild-type or in DAT-CI mice. Overall, these results indicate that cocaine and methylphenidate can increase or decrease DA neurotransmission by blocking reuptake and reducing the exocytotic release, respectively. The biphasic reshaping of DA neurotransmission could contribute to different behavioral effects of psychostimulants, including the calming ones, in attention deficit hyperactivity disorder.

Keywords: Amperometry; Cocaine; Dopamine; Dopamine Transporters; Drug Action; Electrophysiology; Microdialysis; Striatum; Transgenic Mice.


Figures

FIGURE 1.
FIGURE 1.
CPA recordings of the evoked DA efflux and action of cocaine, methylphenidate, and nomifensine in the striata of wild-type mice. A, representative traces showing the effects of cocaine (Coca) at the different time points indicated below. The histogram on the left indicates the effect of cocaine on DA overflow. Note that cocaine (0.3–3 μm) increased the amplitude of the signal by 68 ± 18% with 0.3 μm (n = 4, p = 0.008 F (14.72), one-way ANOVA), by 81 ± 5% with 1 μm (n = 5, p = 2.533E-7 F (250.66), one-way ANOVA), and by 78 ± 19% with 3 μm (n = 11, p = 0.0004 F (17.61), one-way ANOVA). On the other hand, higher concentrations of cocaine (10–100 μm) produced a concentration-dependent reduction of the signal by 23 ± 8% at 10 μm (n = 18, p = 0.005 F (8.77), one-way ANOVA), by 40 ± 8% at 30 μm (n = 28, p = 1.708E-6 F (28.83), one-way ANOVA), and by 85 ± 2% at 100 μm (n = 4, p = 7.967E-6 F (60127), one-way ANOVA). The histogram on the right indicates the effect of cocaine on the decay phase of the DAergic signal. Note that a concentration-dependent increase of the decay phase was seen either with low or high cocaine applications (by 38 ± 1% with 0.3 μm (n = 4, p = 1.596E-13 F (75047), one-way ANOVA), by 81 ± 17% with 1 μm (n = 5, p = 0.001 F (22.63), one-way ANOVA), by 104 ± 16% with 3 μm (n = 9, p = 6.983E-6 F (42.59), one-way ANOVA), by 188 ± 13% with 10 μm (n = 18, p = 1.110E-15 F (195.61), one-way ANOVA), by 322 ± 16% with 30 μm (n = 28, p = 0 F (417.05), one-way ANOVA), and by 421 ± 154% with 100 μm (n = 4, p = 3.685E-14 F (195.70), one-way ANOVA)). Each group of experiments was normalized to the first recordings (15–20 min) of its respective control period. Ctrl, control. **, p < 0.01; ***, p < 0.001. B, the histogram on the left indicates the effect of methylphenidate on DA overflow. Note the increase of the amplitude caused by 3 μm (by 127 ± 25%, n = 6, p = 0.0004 F (26.45), one-way ANOVA)) and the decrease caused by 10 μm (22 ± 1%, n = 4, p = 0.0003 F (2910), one-way ANOVA) and at 30 μm (by 45 ± 7%, n = 4, p = 0.002 F (43.91), one-way ANOVA). The histogram on the right indicates that methylphenidate increases the decay phase of the DAergic signal by 131 ± 1% at 3 μm (n = 6, p = 1.471E-7 F (166.52), one-way ANOVA), by 272 ± 67% at 10 μm (n = 4, p = 0.0001 F (74.74), one-way ANOVA), and by 343 ± 85% at 30 μm (n = 4, p = 0.0003 F (42.36), one-way ANOVA). **, p < 0.01; ***, p < 0.001. C, the histogram on the left indicates the effect of nomifensine on DA overflow. Note that nomifensine increased the amplitude of the signal when superfused at the different concentrations by 92 ± 8% at 0.3 μm (n = 4, p = 0.0002 F (138.95), one-way ANOVA), by 119 ± 17% at 1 μm (n = 11, p = 6.813E-7 F (50.59), one-way ANOVA), by 146 ± 8% at 10 μm (n = 10, p = 0.002 F (11.88), one-way ANOVA), and by 68 ± 17% at 30 μm (n = 7, p = 0.001 F (16.47), one-way ANOVA). The histogram on the right indicates that nomifensine increases in a concentration-dependent manner decay phase of the DAergic signal by 83 ± 4 at 0.3 μm (n = 4, p = 0.00003 F (394.58), one-way ANOVA), by 173 ± 18% at 1 μm (n = 11, p = 3.757E-9 F (97.97), one-way ANOVA), by 415 ± 74% at 10 μm (n = 5, p = 0.0004 F (31.58), one-way ANOVA), and by 657 ± 56% at 30 μm (n = 7, p = 6.140E-8 F (137.95), one-way ANOVA) (**, p < 0.01; ***, p < 0.001).
FIGURE 2.
FIGURE 2.
CPA recordings of the evoked DA efflux and action of cocaine, methylphenidate, and nomifensine in the striata of DAT-CI mice. A, traces showing the effects of cocaine (Coca) (10 μm) at the different time points indicated below. The histogram on the left indicates the effect of cocaine on DA overflow. Note that cocaine (0.3 μm) did not change the amplitude of the signal that was instead decreased by 1–100 μm drug (by 1 ± 1% at 0.3 μm (n = 4, p = 0.544 F (0.41), one-way ANOVA), by 17 ± 7% at 1 μm (n = 6, p = 0.029 F (6.39), one-way ANOVA), by 33 ± 2% at 3 μm (n = 14, p = 3.657E-7 F (75.44), one-way ANOVA), by 57 ± 2% at 10 μm (n = 49, p = 0 F (860.53), one-way ANOVA), by 85 ± 2% at 30 μm (n = 19, p = 0 F (1931), one-way ANOVA), and by 93 ± 1% at 100 μm (n = 4, p = 1.659E-9 F (60127), one-way ANOVA)). The histogram on the right indicates that cocaine reduces the decay phase of the DAergic signal by 1 ± 3% with 0.3 μm (n = 4, p = 0.805 F (0.07), one-way ANOVA), by 7 ± 1% with 1 μm (n = 6, p = 0.082 F (3.73), one-way ANOVA), by 13 ± 2% with 3 μm (n = 14, p = 0.0008 F (14.21), one-way ANOVA), by 21 ± 2% with 10 μm (n = 49, p = 0 F (126.25), one-way ANOVA), by 46 ± 8% with 30 μm (n = 19, p = 1.11E-16 F (123.30), one-way ANOVA), and by 99 ± 1% with 100 μm (n = 4 p = 6.991E-9 F (29290), one-way ANOVA). Ctrl, control. (*, p < 0.05; ***, p < 0.001). B, the histogram on the left indicates the effect of methylphenidate on DA overflow. Note the decrease of the amplitude caused by 3 μm (by 4 ± 1%, n = 7, p = 0.014 F (8.19), one-way ANOVA), at 10 μm (by 16 ± 2%, n = 8, p = 0.001 F (15.65), one-way ANOVA), and at 30 μm (by 29 ± 4%, n = 4, p = 0.002 F (47.46), one-way ANOVA). The histogram on the right indicates that methylphenidate decreases the decay phase of the DAergic signal by 1 ± 1% with 3 μm (n = 7, p = 0.298 F (1.17), one-way ANOVA), by 9 ± 1% with 10 μm (n = 8, p = 0.0001 F (27.59), one-way ANOVA), and by 38 ± 4% with 30 μm (n = 4, p = 0.0004 F (116.32), one-way ANOVA) (*, p < 0.05; **, p < 0.01; ***, p < 0.001). C, the histogram on the left indicates the effect of nomifensine on DA overflow. Nomifensine increase the amplitude of the signal when superfused at the different concentrations by 31 ± 13% at 0.3 μm (n = 8, p = 0.029 F (5.90), one-way ANOVA), by 58 ± 5% at 1 μm (n = 20, p = 4.393E-13 F (115.58), one-way ANOVA), by 88 ± 19% at 10 μm (n = 5, p = 0.001 F (20.78), one-way ANOVA), and by 56 ± 17% at 30 μm (n = 8, p = 0.004 F (11.14), one-way ANOVA). The histogram on the right indicates that nomifensine increases the decay phase of the DAergic signal by 46 ± 18% with 0.3 μm (n = 8, p = 0.0002 F (24.35), one-way ANOVA), by 83 ± 9% with 1 μm (n = 20, p = 4.577E-11 F (82.57), one-way ANOVA), by 130 ± 46% with 10 μm (n = 10, p = 0.02 F (11.42), one-way ANOVA), and by 358 ± 43% with 30 μm (n = 8, p = 0.0002 F (24.15), one-way ANOVA). Note that the increase in the amplitude of the DAergic signal in the DAT-CI mice caused by nomifensine is almost half of that evoked in wild-type animals. (*, p < 0.05; **, p < 0.01; ***, p < 0.001).
FIGURE 3.
FIGURE 3.
Field potential recordings of the corticostriatal transmission and evoked DA overflow in the presence of cocaine in DAT-CI mice. A, cocaine (Coca) (30 μm) did not change the amplitude of the field potential (97 ± 2% of control (Ctrl), n = 4, p = 0.618 F (0.28), one-way ANOVA), whereas it reduced the evoked DA overflow to 51 ± 2% of control (n = 4, p = 0.0002 F (60.36), one-way ANOVA). B, the reducing effects of cocaine (10 μm) (n = 49) when coapplied with the other DAT inhibitor nomifensine (30 μm, n = 6) (by 50 ± 2%, n = 6, p = 0.179 F (2.12), one-way ANOVA), the SERT blocker fluoxetine (10 μm, n = 8) (by 49 ± 2%, n = 8, p = 0.094 F (3.24), one-way ANOVA), the NET blocker reboxetine (10 μm) (by 56 ± 2% (n = 5, p = 0.944 F (0.005), one-way ANOVA), and the adrenergic antagonists phentolamine (3 μm) (by 40 ± 7%, n = 6, p = 0.560 F (0.344), one-way ANOVA) and pindolol (1 μm) (by 37 ± 11%, n = 4, p = 0.409 F (0.691)). Note that neither of these treatments modified the effects of cocaine. ns, not significant.
FIGURE 4.
FIGURE 4.
Repetitive tissue stimulation evokes a DA release that is inhibited by cocaine in DAT-CI mice. A, row traces of an experiment. Note that cocaine (Coca) (30 μm) reduced, in a reversible manner, the evoked DA release that was caused by a repetitive electrical stimulation of the tissue. Ctrl, control. B, the reversible inhibition of DA release caused by cocaine (30 μm) in 20-min application (n = 9) (*, p < 0.05). C, an inhibition of the stimulated efflux of DA as detected by constant potential amperometry was detected by in vitro microdialysis after 20 min of cocaine application (by 36 ± 17%, n = 16; p = 0.007; ANOVA (F 2, 37 = 5.624; p < 0.007) **, p < 0.01).
FIGURE 5.
FIGURE 5.
The effect of cocaine and methylphenidate on synapsin I activation in striatal presynaptic terminals. A–C, representative immunoblots of synapsin I (syn I) and synapsin phosphorylation (p-syn) are shown in different experimental conditions. Sulpiride (5 μm) was always present throughout the experiment. Ctrl, control; Coca, cocaine. B–D, quantification of phosphorylation of synapsin was expressed as ratio of anti-phospho-synapsin on anti-synapsin I. Values are mean ± S.E. of five experiments. *, p < 0.05 versus control.
FIGURE 6.
FIGURE 6.
Effect of cocaine and methylphenidate on the release of the fluorescent false neurotransmitter FFN102 in wild-type mice. A, images of FFN102 loaded into dopaminergic terminals of the dorsal striatum before and 51 s after 10-Hz electrical stimulation in the control and with 30 μm cocaine. Scale bars = 8 μm. Both 30 μm cocaine and methylphenidate (not shown) decreased the stimulation-dependent fluorescent signal. B, raw percentage changes in average puncta intensity over time (inset) and then linearly corrected for rundown. The arrow represents the start of cocaine exposure. 10-Hz electrical stimulation starts at t = 0 and continues until the final time point. Error bars represent S.E. The slope of the signal rundown was not affected by cocaine. C, values of maximum fluorescence after 51 minutes of a 10-Hz electrical stimulus. The control signal was increased by 16.5 ± 1.4% in controls (mean ± S.E., n = 6), by 5.0 ± 0.2% (n = 5) in 30 μm cocaine, and 8.8 ± 1.2% in 30 μm methylphenidate (n = 5). Both cocaine and methylphenidate inhibited the evoked increase in fluorescence (p < 0.0001, one-way ANOVA; p < 0.0001 for cocaine versus control; p < 0.0001 for methylphenidate versus control, Tukey-Kramer test).

Similar articles

Cited by

References

    1. Koob G. F., Bloom F. E. (1988) Cellular and molecular mechanisms of drug dependence. Science 242, 715–723 - PubMed
    1. Kuhar M. J., Ritz M. C., Boja J. W. (1991) The dopamine hypothesis of the reinforcing properties of cocaine. Trends Neurosci. 14, 299–302 - PubMed
    1. Chen R., Han D. D., Gu H. H. (2005) A triple mutation in the second transmembrane domain of mouse dopamine transporter markedly decreases sensitivity to cocaine and methylphenidate. J. Neurochem. 94, 352–359 - PubMed
    1. Penberthy J. K., Ait-Daoud N., Vaughan M., Fanning T. (2010) Review of treatment for cocaine dependence. Curr. Drug Abuse Rev. 3, 49–62 - PubMed
    1. Amalric M., Koob G. F. (1993) Functionally selective neurochemical afferents and efferents of the mesocorticolimbic and nigrostriatal dopamine system. Prog. Brain Res. 99, 209–226 - PubMed

Publication types

LinkOut - more resources