. 2013 May 15;6(1):12.
doi: 10.1186/1939-8433-6-12.

RNAi mediated down regulation of myo-inositol-3-phosphate synthase to generate low phytate rice

Affiliations

RNAi mediated down regulation of myo-inositol-3-phosphate synthase to generate low phytate rice

Nusrat Ali et al. Rice (N Y). .

Abstract

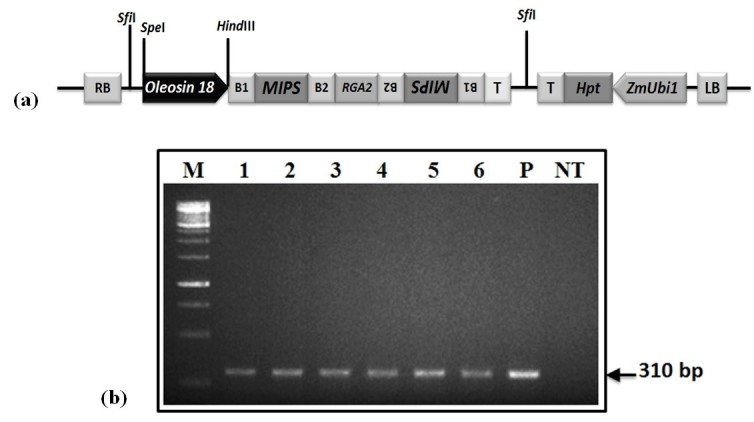
Background: Phytic acid (InsP6) is considered as the major source of phosphorus and inositol phosphates in cereal grains. Reduction of phytic acid level in cereal grains is desirable in view of its antinutrient properties to maximize mineral bioavailability and minimize the load of phosphorus waste management. We report here RNAi mediated seed-specific silencing of myo-inositol-3-phosphate synthase (MIPS) gene catalyzing the first step of phytic acid biosynthesis in rice. Moreover, we also studied the possible implications of MIPS silencing on myo-inositol and related metabolism, since, first step of phytic acid biosynthesis is also the rate limiting step of myo-inositol synthesis, catalyzed by MIPS.

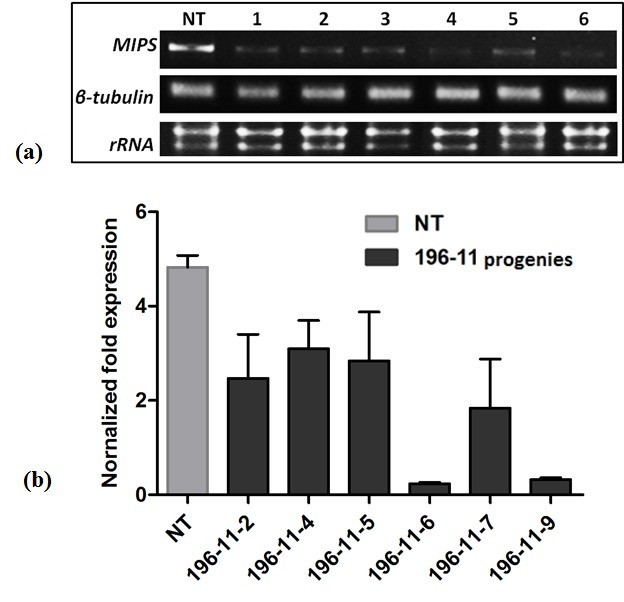
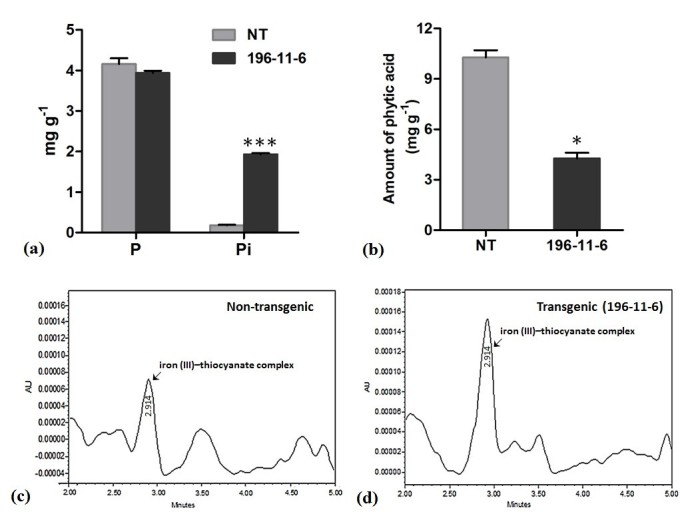
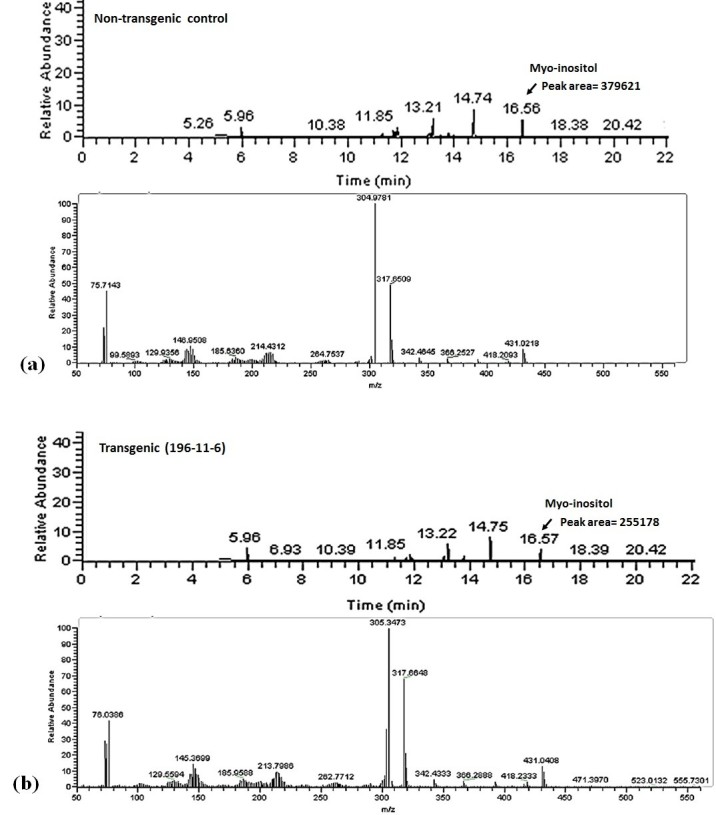
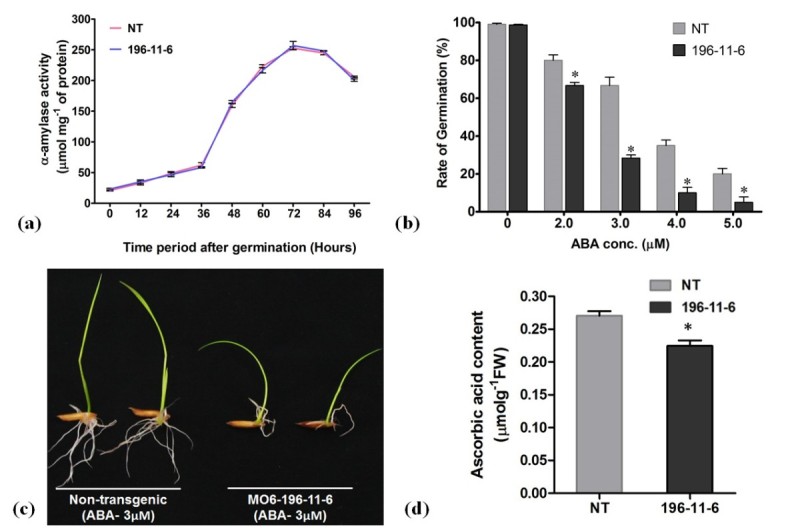
Results: The resulting transgenic rice plants (T3) showed a 4.59 fold down regulation in MIPS gene expression, which corresponds to a significant decrease in phytate levels and a simultaneous increment in the amount of inorganic phosphate in the seeds. A diminution in the myo-inositol content of transgenic plants was also observed due to disruption of the first step of phytic acid biosynthetic pathway, which further reduced the level of ascorbate and altered abscisic acid (ABA) sensitivity of the transgenic plants. In addition, our results shows that in the transgenic plants, the lower phytate levels has led to an increment of divalent cations, of which a 1.6 fold increase in the iron concentration in milled rice seeds was noteworthy. This increase could be attributed to reduced chelation of divalent metal (iron) cations, which may correlate to higher iron bioavailability in the endosperm of rice grains.

Conclusion: The present study evidently suggests that seed-specific silencing of MIPS in transgenic rice plants can yield substantial reduction in levels of phytic acid along with an increase in inorganic phosphate content. However, it was also demonstrated that the low phytate seeds had an undesirable diminution in levels of myo-inositol and ascorbate, which probably led to sensitiveness of seeds to abscisic acid during germination. Therefore, it is suggested that though MIPS is the prime target for generation of low phytate transgenic plants, down-regulation of MIPS can have detrimental effect on myo-inositol synthesis and related pathways which are involved in key plant metabolism.


Figures

Figure 1
Figure 1
Vector construct and molecular analysis of transgenic plants. (a) Partial map of RNAi vector construct (pOle18-MIPS-006) used for Biolistic transformation of indica rice cultivar, (b) gel picture of PCR analysis showing bands of RGA2 intron as amplified from the transgenic rice plants. (M = 1 Kb gene ruler, P = Positive control, NT = Non-transgenic plant, lane 1-6 = Progenies of line MO6-196).
Figure 2
Figure 2
Southern hybridization analysis of transgenic rice plants. Genomic DNA (10 μg) of T3 progenies of line MO6-196 digested with Eco RI showing stable integration of RGA2 intron in transgenic rice plants. The position and sizes of markers are indicated (NT = Non-transgenic plant, lane 1-5 = Progenies of line MO6-196).
Figure 3
Figure 3
Different agronomic characters analyzed in transgenic and non-transgenic rice plants. (a) Plant height and panicle length (cm), (b) number of tillers and effective tillers, (c) number of grains per panicle and (d) 1000 seeds dry weight of non-transgenic and transgenic rice plants. No significant differences (P ≥ 0.05) were observed.
Figure 4
Figure 4
Expression analysis of transgenic rice plants. (a) RT-PCR analysis of T3 transgenic seeds of MO6-196, as compared to the internal control β tubulin reveals down-regulation in the transcript level of MIPS (b) Expression levels of MIPS as determined by Quantitative real time PCR. The normalized fold expression clearly indicates varied level of silencing, the maximum being 4.59 fold as observed in 196-11-6.
Figure 5
Figure 5
Phosphorus and phytic acid content in seeds. (a) Total phosphorus and Pi fractions in non-transgenic (NT) and T3 transgenic seeds and (b) amount of phytic acid in non-transgenic (NT) as compared to T3 low phytic acid transgenic seeds. The symbols * and *** indicates significant differences at P = 0.05 and 0.001 respectively. (c &d) HPLC traces showing peak of iron III- thiocyanate complex of non-transgenic and transgenic seed extracts of phytic acid after reaction with iron (III)- thiocyanate.
Figure 6
Figure 6
Chromatogram showing peaks of myo -inositol (RT- 16.56) and respective mass fragments as observed by GC/MS analysis. (a) Non-transgenic and (b) T3 transgenic seeds of 196-11-6. The peak corresponding to myo-inositol has been marked by an arrow. Myo-inositol was quantified as a hexa-trimethylsilyl ether derivative and was identified by comparing the mass fragmentation pattern with the database library NIST07.
Figure 7
Figure 7
Analysis during seed germination and estimation of ascorbate content. (a) Alpha amylase activity analyzed at different time intervals after germination, (b) altered response of transgenic seeds during germination in presence of different concentrations of ABA, (c) picture showing increased sensitivity of transgenic seeds in presence of ABA (3 μM) at 7th day of germination and (d) Ascorbic acid content in non-transgenic (NT) and T3 transgenic rice seeds. The symbols * indicates significant differences at P = 0.05.

References

    1. Abid G, Silue S, Muhovski Y, Jacquemin JM, Toussaint A, Baudoin JP. Role of myo-inositol phosphate synthase and sucrose synthase genes in plant seed development. Gene. 2009;439:1–10. doi: 10.1016/j.gene.2009.03.007. - DOI - PubMed
    1. Alimohammadi M, Silva K, Ballu C, Ali N, Khodakovskaya MV. Reduction of inositol (1,4,5)-trisphosphate affects the overall phosphoinositol pathway and leads to modifications in light signaling and secondary metabolism in tomato plants. J Exp Bot. 2012;63:825–835. doi: 10.1093/jxb/err306. - DOI - PMC - PubMed
    1. Barrientos L, Scott JJ, Murthy PPN. Specificity of hydrolysis of phytic acid by alkaline phytase from lily pollen. Plant Physiol. 1994;106:1489–1495. doi: 10.1104/pp.106.4.1489. - DOI - PMC - PubMed
    1. Bernfeld P. Amylases α and β. In: Colowick SP, Kalpan NO, editors. Methods in Enzymology. New York 1: Academic Press; 1955. pp. 149–158.
    1. Borg S, Brinch-Pedersen H, Tauris B, Holm PB. Iron transport, deposition and bioavailability in the wheat and barley grain. Plant Soil. 2009;325:15–24. doi: 10.1007/s11104-009-0046-6. - DOI

LinkOut - more resources